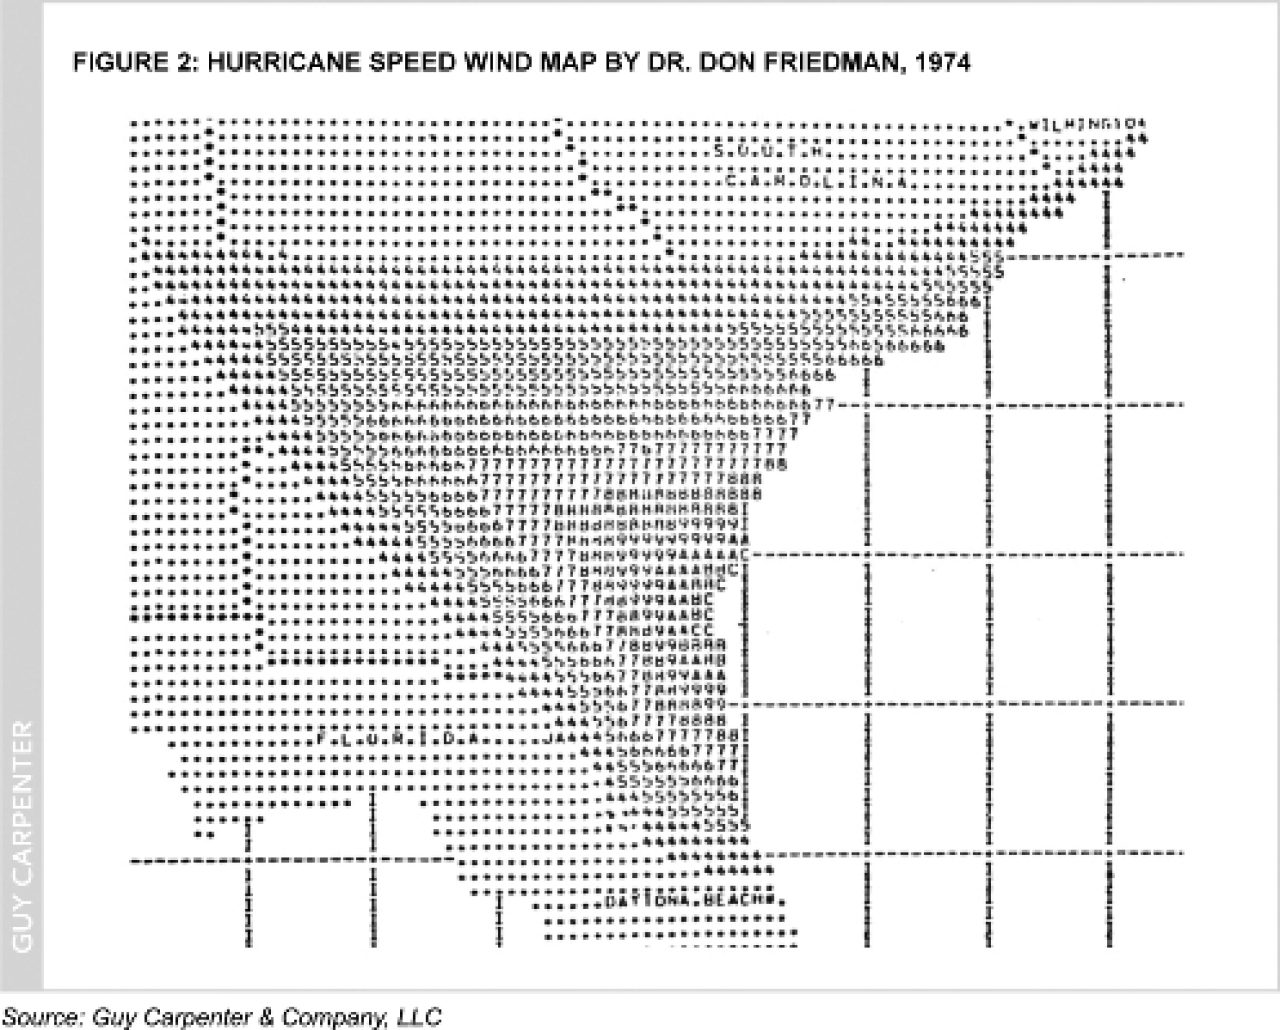
Computerized simulation modeling of the potential impact and risk of natural disasters – from multiple perils – was pioneered by Dr. Don G. Friedman at the Travelers Insurance Company in the 1960s (1). Figure 2, below, is an example of one of his simulated wind speed maps, circa 1974. In 1987, Karen Clark founded the first cat modeling firm, AIR, and three more firms, RMS, EQECAT and ARA, came on the scene in 1988, 1994 and 1999, respectively. By the early 1990s Guy Carpenter had become a “power user” of cat models and augmented its capabilities by acquiring the intellectual property – and hiring some colleagues of the retiring Dr. Friedman.
Today, both the cat modeling industry and Guy Carpenter’s deep involvement with cat models continue to evolve.
Since the introduction of the first commercially available cat models in the late 1980s model updates have occurred regularly. There are many reasons that the models change. They include advances in computer technique and capabilities, improved scientific understanding of natural perils, expanded coverage of phenomena included in the models, improved understanding of the physical response of buildings and other property to the impact of catastrophes and enhanced knowledge of the residential and commercial building stock in the countries being covered. Many of these improvements are driven by experience in recent catastrophes. Modeling firms go to extraordinary lengths to collect and process as much data as possible.
Early cat model users were distressed to discover that models from different vendors were likely to produce materially different risk estimates for the same set of insured exposures. As model builders’ experience – and data – increased over time, the models have tended to converge – somewhat. There are still material, sometimes dramatic, differences between models, especially when examined at a geographically localized level.
Cat model users might be tempted to use the differences between the models as benchmarks of uncertainty in the model results. This is natural. This is also incomplete, because model developers share (some of) the same scientific methods and data. They are by no means entirely independent.
Uncertainty is widely recognized within the modeling community and has long been a prominent topic at modeling conferences. In a 1997 conference in Bermuda, cat modeling representatives were pressed for a quantitative measure of uncertainty around 100-year return periods. No modeler was willing or able to do so.
Since then, discussion of uncertainty has not advanced much. We are aware of only one public instance where modelers explicitly quantified uncertainty levels in their results: this occurred for the Florida Commission on Hurricane Loss Projection Methodology. That was a welcome development because it provided an effective “caveat” to model results and helped users put them into an appropriate context. However, standards for how to measure this uncertainty are in their infancy. We will return to this concept in the next section.
Uncertainty in Cat Model Results
In 1999 Guy Carpenter‘s Dr. David Miller published a study (2) that determined lower bounds on the amount of uncertainty that had to be present in U.S. hurricane risk models. He wrote, “because hurricane records in the Atlantic basin span only the past 100 years, any simulation of hurricane activity in this region will ultimately be limited by this finite number of historically observed hurricane events.” He concluded that, for a large, nationally distributed portfolio of insured exposures, the uncertainty around an estimate of high (100 years or more) return period losses amounts to multiples, not fractions, of the estimate.
Guy Carpenter subsequently issued a white paper entitled Uncertainty in Catastrophe Models (3), expanding on these results. It considered other components of missing knowledge and scientific uncertainty that could only add to the overall uncertainty.
That paper explained that uncertainty arises from four types of potential errors:
- Sampling error: Inaccuracy arising from a limited data sample. This is the type of error quantified in Dr. Miller’s study.
- Model specification error: Uncertainty as to whether the correct type of formula has been chosen. Included in this concept is the lack of understanding of physical chaotic phenomena underlying catastrophic behavior and the lack of understanding of building structure behavior under severe loads.
- Nonsampling error: Uncertainty as to whether all relevant factors have been considered. This includes the still debated effects of the El Niño-La Niña cycle and global climate change on the rate of landfalling hurricanes. It also includes known phenomena not modeled (for example, tree damage, cleanup costs, looting), novel legal interpretations of liability or postevent regulatory actions, interaction of follow-on events such as freeze following a hurricane and the disruption and slow economic recovery that follows a very large disaster.
- Numerical error: Arises through the use of approximations in calculations. The Monte Carlo technique, which involves running thousands to millions of simulated events and is widely used in cat modeling, is one such approximation.
What has not been addressed and needs to be emphasized here, is that additional, external, uncertainties come in to play when one uses a model. These principally arise from the quality of the data being fed into the model, but also include the use of “switches” (model option settings) that might not be set appropriately for the analysis at hand.
Uncertainty in Catastrophe Models made certain assumptions about the additional three types of model-inherent errors and concluded that, for a national portfolio of exposures and a typical return period of interest, a two standard error interval for a probable maximum loss (PML) goes from 50 percent to 230 percent of the PML estimate produced by the model. This interval can be understood as representing a 68 percent chance of the true answer lying within the indicated range. So, in other words:
If the (1999) cat model says:
“Your 100 year return period loss is $1,117,243,572,”
what it really means is:
“Your 100 year return period loss is about a billion dollars;
but it could be 500 million dollars or maybe two and
a half billion dollars… something like that.”
This applies to national portfolios. The uncertainty for geographically localized portfolios, not analyzed in that white paper, must of necessity be larger.
The assumptions in Uncertainty in Catastrophe Models about model specification and nonsampling error reflect conditions prevalent a decade ago when it was published. The cat modeling industry should be credited with advances in model structure and the use of better underlying science – perhaps, now, model specification and nonsampling error factors should be smaller. However, the underlying limitations of sampling error and numerical approximation error still apply (another 11 years of hurricane experience have hardly made a difference here), and when one moves to smaller geographic units, the sampling error increases. (The nonsampling error probably increases as well, but we will give the modelers the benefit of the doubt on that.)
In statistics, the rule is: less data means more uncertainty. Consider, for example, Florida and Texas. They have experienced about 30 percent and 16 percent, respectively, of the major recorded U.S. landfalling hurricanes. Because sampling error is inversely proportional to the square root of the number of observations, the sampling error-driven uncertainty bands associated with PMLs on state-concentrated portfolios should be 1.8 and 2.5 times wider, respectively, than they would be for a national portfolio.
It is not as simple at the county level. Adjacent counties’ experience is not “independent” (in statistical parlance) so there should be an effort to carve the coastline into a meaningful number of relatively independent zones. There are perhaps four such zones in a typical coastal state. With that assumption, the county-level sampling error contributions should be about double the state error.
Combining all of the above assumptions, we can update the 1999 white paper and crudely estimate two standard error intervals for U.S. national, state and localized hurricane PML estimates as follows:
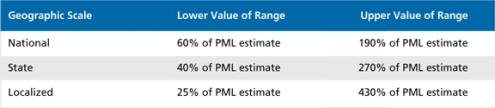
Figure 3 shows the two standard error uncertainty bands implied by reports given by the three principal model vendors. They were given to the Florida Commission for the 100-year hurricane PML of the Florida Hurricane Catastrophe Fund. It also shows the band implied by the above table. Each two-color bar represents one model’s estimates. The PML estimate in the center has been scaled to 100 percent. The top of the bar represents the upper uncertainty bound and the bottom represents the lower uncertainty bound. Evidently, the three vendors used dramatically different assumptions and/or methods for computing the uncertainties, and none of them are as wide as we calculate they must be.
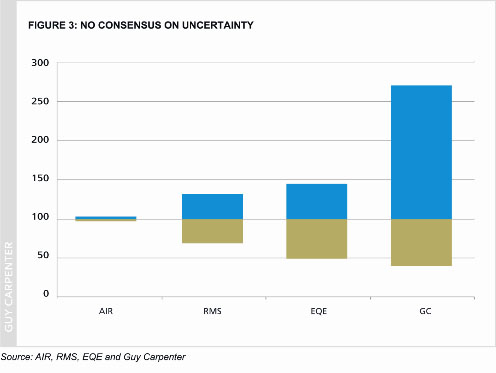
The three major model vendors report widely varying levels of uncertainty in their outputs. We believe it is underestimated in all cases – in one instance, by a huge margin. GC bar is based on Guy Carpenter’s own analysis.
While the analyses discussed above focused on hurricane models in the United States, much of the same considerations apply to other perils and other countries, perhaps with more force. Atlantic hurricanes are represented by many decades of data and intense study. Surely the uncertainties surrounding earthquake risk in the New Madrid region of the United States or less well documented perils in other parts of the world must be larger.
In 1974, Dr. Friedman described his work as “providing an order of magnitude measure of overall loss potential associated with natural hazards.” This simple humility is worth emulating.
Notes:
1 Friedman, Don G. (1984) Natural Hazard Risk Assessment for an Insurance Program, The Geneva Papers on Risk and Insurance, Proceedings of the First Meeting of the International Working Group on Natural Disasters and Insurance (I), Vol. 9, No. 30, January.
2 Miller, David (1999) Uncertainty in Hurricane Risk Modeling and Implications for Securitization, Casualty Actuarial Society Discussion Paper Program.
3 Major, John A. (1999) Uncertainty in Catastrophe Models Part I: What is It and Where Does It Come From? (February); Uncertainty in Catastrophe Models Part II: How Bad is It? (March), Financing Risk & Reinsurance, International Risk Management Institute.