Micah Woolstenhulme, Manager, ERM Services, Strategic Advisory
The Insurance Risk Benchmarks Research is an ongoing project sponsored by Guy Carpenter & Company and Oliver Wyman to assist capital model, but robust review of relative historical performance invariably improves the codification of certain systemic risks.

The Annual Statistical Review, a report recently published from this year's research, is a statistical dive into industry trends and dynamics. It builds the bridge between historical results and future uncertainties and supports accurate risk quantification by industry segment and across cycles. This quantification informs a company's competitive strategy, from underwriting profile to capital management to tactics surrounding risk transfer.
Research at the Forefront
Many factors contributed to a successful 2013 for the P&C industry. Reserve releases continue for prior accident years and loss ratios currently booked for accident year 2013 are lower than long-term averages for every line of business. It is important in this environment to pay close attention to inflationary trends and their potential impact on development of known claims.
Empirical results suggest that the key to stable profitability in homeowners business is regional diversification and risk management. Homeowners loss ratios exhibit a strong dependence on regional profile, and the larger market players have fared better on average and also with volatility.
In other lines of business, regional specialists have exhibited equal or lower volatility than the national carriers. Products liability is one line where opportunities for localized profitability are available. Private passenger auto loss ratios do not appear to be materially better or worse in individual regions.
The strongest loss ratio correlations exist between lines of business driven by trends in bodily injury costs. This suggests that risk models need to consider the common dependence of these claims on systemic drivers of loss cost. In fact, correlation is a predictable function of market share.
Focus on the E&S Market Segment
Market segments are carefully defined in the research to provide insurers with statistical benchmarks closely reflecting their own profile, and the definition of the excess and surplus lines (E&S) segment includes companies whose net results properly reflect their E&S business rather than that of the insurance group to which they belong.
The accident year ultimate loss ratio for the E&S segment, net of reinsurance for all lines combined has outperformed the industry in 30 out of the last 34 years. Clearly the freedom of rate and form in the E&S marketplace has led to comparatively profitable underwriting opportunities in the long term.
Standardized financial modeling, based on this research, facilitates comparison of the relative tradeoff of risk and return across the industry. In this view, a composite of E&S companies presents an average prospective return on surplus of 4 percent with a surplus volatility of 9 percent, comparing favorably with other market segments.
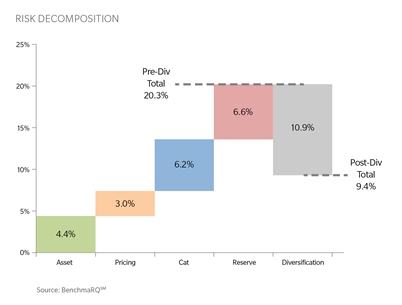
We can divide surplus volatility into its main drivers - four categories of risk: asset, pricing, cat, and reserve.
This analysis suggests that natural catastrophe risk and reserve risk pose the largest capital adequacy threats for E&S carriers, and each to a comparable degree.
Further work with the standardized capital model for the E&S composite indicates that in general, liability lines of business are currently creating the most prospective value.
The Insurance Risk Benchmarks research provides empirical evidence and prospective risk modeling to chart a course toward future financial success. Whereas these results provide only a brief view into the research, please contact riskbenchmarks@guycarp.com for more information.
Working with Guy Carpenter Strategic Advisory, our Excess and Surplus Lines Specialty Practice helps E&S carriers optimize the use of capital and achieve profitable growth through a range of customized solutions.