
Julia Chu, Managing Director
The changes in today's property and casualty (P&C) insurance marketplace present insurers with many challenges to capital management and risk transfer techniques. Insurers are compelled to leverage their capital positions to increase and diversify their market shares to an unprecedented degree. Preserving the status quo is not an option for long-term viability. Profitable growth is a key priority for companies seeking additional return. Companies need to enter new lines of business or geographies strategically with proper analysis. Guy Carpenter offers proprietary analytical tools, intellectual capital and expertise to help companies determine and evaluate their growth plans while maintaining an acceptable level of risk and profitability.
The Insurance Risk Benchmarks, our ongoing comprehensive industry research initiative now in its sixth year, provides clients with access to unbiased statutory financial data from over 1,000 U.S. insurance companies. We analyze the data from this research to assess the competitive landscape for a given line of insurance business. The result of the analysis and an understanding of an individual company's goals and objectives guide us to focus on specific areas for a deeper strategic evaluation. We help our client determine the best way to expand its insurance portfolio, whether through expansion to additional states or by writing new lines of business.
Identification of profitable growth strategies continues with a refinement of the potential opportunities - evaluation of the size and competitiveness of the market, profitability, downside risk and correlation to an insurer's existing portfolio. The outcome yields a State Scoring Model to help summarize the findings.
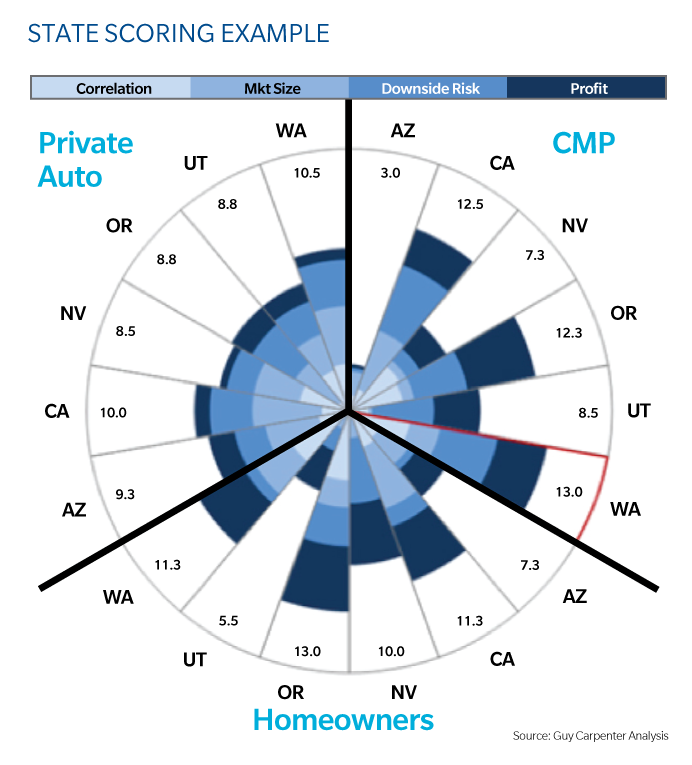
A hypothetical case study provides an example of how the State Scoring Model works. Figure 1 presents the Model for a hypothetical insurer considering expansion into various lines of business (commercial multi-peril, homeowners and private passenger auto insurance), in the upper northwestern states. Each slice of the pie chart and its components represent a score or ranking for each line of business in each state - a better score indicates a better opportunity in that line of business. In this example, this company would benefit from an expansion into commercial multi-peril insurance in Washington State, Oregon and California. The scored factors, each with a customized weight, help users align the growth opportunities with the company's objectives.
Notes (State Scoring Example, above):
Correlation is based on Loss and Loss Adjustment Expense of a company's total book of business and the industry's history in that particular line of business.
Market size is the industry direct written premium in the particular state.
Downside risk is a 1 in 100 probable maximum loss ratio for the industry at the state line of business level.
Profit is the average underwriting margin for the last five years.
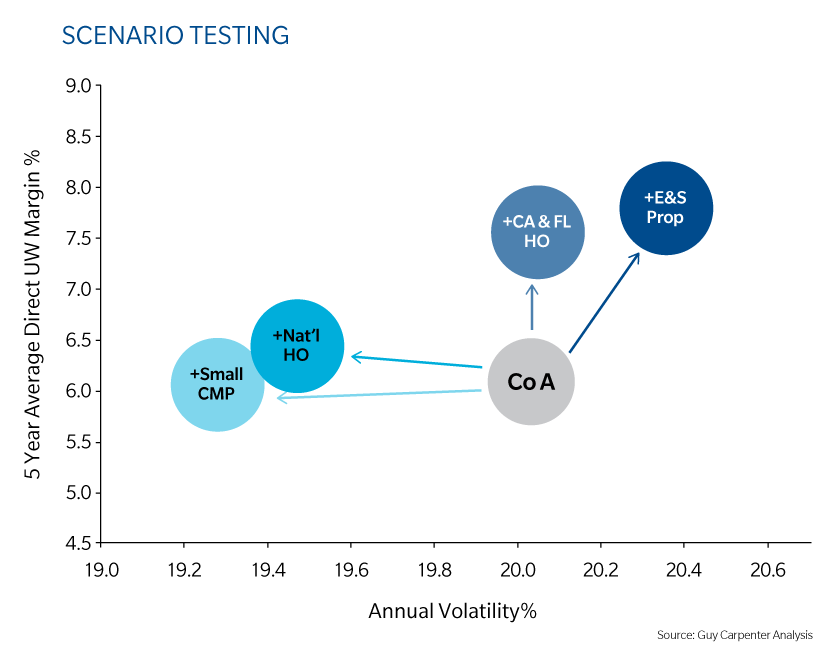
The analysis progresses with a retrospective financial analysis that demonstrates "what if" the company had a share of the wallet in that particular business. Synergies between the existing business and growth opportunities can be exposed. Our research compares annual volatility, which is the standard deviation of ten or more years of a company's underwriting margin, with the pro-forma profitability or five year average underwriting margin if the company had written specific businesses.
Figure 2 (below) provides another hypothetical company example:
- if Company A had written excess and surplus property insurance, its profitability would have increased, but at a cost of some underwriting margin volatility;
- additionally, writing California and Florida homeowners insurance would have increased profitability but kept volatility unchanged;
- writing national homeowners insurance however, decreased volatility and kept profitability unchanged; and
- writing small commercial multi-peril decreased volatility to the largest degree but only slightly decreased profitability.
If this retrospective view shows company compatibility with specific states and lines of business, there is an option for further analysis under a prospective view.
Guy Carpenter's BenchmaRQ® platform helps clients understand the prospective impact on return and volatility. Observations based on historical events may not encompass the full potential of risk associated with the business - particularly true for catastrophe events because the range of potential events can be difficult to observe in the historical data. Capital model results bridge the historical analysis with a current view of the potential risk, enabling measurement and decision making in a risk-aware framework. The retrospective and prospective analyses provide insurance companies with real data for decision making to drive growth plans.
The same framework can be used to measure the impact of mergers and acquisitions, exiting a particular line of business or other strategic decisions where understanding the trade-off between return and risk is part of the decision-making process - ensuring strategic options are aligned with the company's risk appetite and risk tolerance.