
Hurricane Sally made landfall around 5:45 AM EDT on September 16 as a category-2 hurricane, with maximum sustained winds of 105 mph. The core of Sally moved ashore over Orange Beach, Alabama after gaining strength on its final approach to the coast. The slow forward motion of the storm together with its gain in intensity brought prolonged periods of heavy rainfall, storm surge and destructive winds. Considerable property damage has been reported due to storm surge, inland flooding, and wind effects. At least three fatalities have been reported to date. Hurricane Sally made landfall sixteen years to the day following Hurricane Ivan (2004) in almost the same location; Ivan left catastrophic damage due to storm surge and severe wind impacts to portions of northwest Florida and southern Alabama.
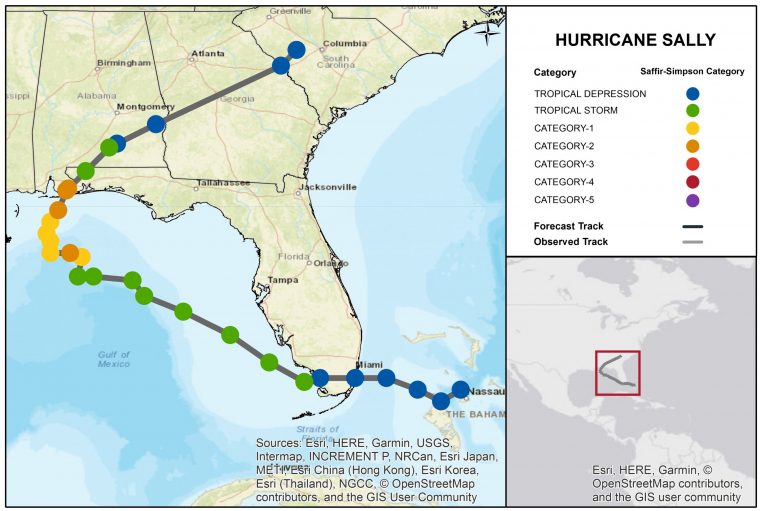
Hurricane Sally Track and Position Reports. Source: NOAA/NHC. The Hurricane Sally CAT-i bulletin comprises the following sections:
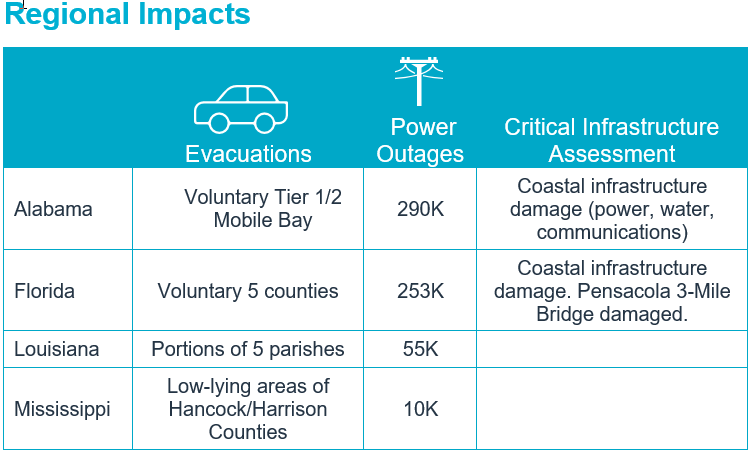
- Regional Impacts
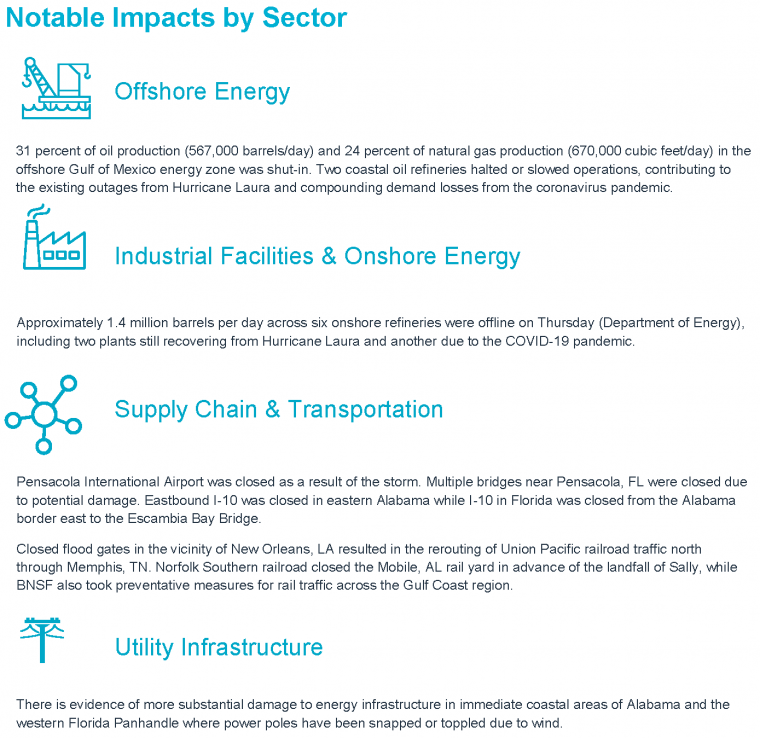
- Notable Impacts by Sector
- Key Dates in the Timeline
- Physical Discussion with Peak Meteorological Statistics
Impacts Discussion
At least three fatalities have been reported by media. Impacts of greatest severity have occurred in immediate coastal areas near the Alabama-Florida border. Seawater inundation due to storm surge has caused considerable damage to structures and auto as well as marine interests. Sally left boats on land or sank them at the dock. Prolonged exposure to winds of category-2 hurricane strength have caused damage to both roof and wall of affected properties, in addition to apparent damage from wind-driven debris. Power poles have also been toppled or snapped in the most severely affected areas. In the meantime, excessive rainfall has produced historic flooding for areas well inland. At least eight waterways in south Alabama and the Florida Panhandle were expected to hit major flood levels, in some cases record flood levels, putting bridges and some homes at risk for flooding. Downed trees and powerlines also extend over a broad area away from the track of the storm and well inland, along with light to moderate property damage. It is also evident that treefall due to strong wind gusts has been amplified by the excessive rainfall. At least 570,000 power outages have been reported for homes and businesses in Florida and Alabama, according to media.
Initial Loss Estimates
It is too early to determine the full scope and severity of impacts from Sally. However, initial media reports indicate an economic loss estimate of at least USD 2-3 billion according to Enki research; this estimate could increase depending on severity of inland flood impacts.
Alabama
In Orange Beach, at least one fatality and one missing person have been reported to date by media. At least 50 people were rescued from flooded homes and taken to shelters. One condominium building suffered damage to the roof and completely lost one wall segment exposing at least five floors. At least one structural fire was reported, and the severity of flooding impeded firefighter access to the area. Disruption to water and cellular service have been reported in addition to widespread power outages. In Dauphin Island, an emergency crew rescued two people after their home lost the roof and began to disintegrate. Crushed boats and debris were also reported on the island, and downed trees damaged both houses and cars. Portions of the island were accessible only by four-wheel drive vehicles. Many piers along the coast suffered significant damage including the one at Gulf State Park. Inland flooding has been a significant concern and affected waterways include the Styx and Fish Rivers, Murder Creek and Big Escambia Creek. Gulf Shores, Orange Beach and Fort Morgan are closed to visitors until at least September 26.
Florida
Coastal areas of the western Florida Panhandle experienced wind damage to both roof and walls with evidence of damage from wind-driven debris. In Santa Rosa County, at least 85 people were rescued from a nursing home. In Escambia County, at least 377 people were rescued from flooded areas with more than 40 people rescued from high water within a single hour. A family of four was found in a tree. Seawater inundation was reported in portions of both Pensacola Beach and Pensacola, with water levels reaching up to five feet. Seawater intrusion through stormwater management systems was evident from media reports. Flood effects in downtown Pensacola, with water depths of at least three feet, left debris and flooded cars and property damage from both inundation and water velocity. In the meantime the Pensacola Bay Bridge lost a significant section after it was struck by a construction crane, and Interstate 10 was closed from the Alabama State Line to the Escambia Bay Bridge due to flooding. The Interstate has since reopened according to media reports. Travel was made impossible for many areas as a result of damaged roads and bridges, and seawater inundation trapped many vehicles in coastal areas as the storm gained strength and size. The Pensacola International Airport was also closed. At least 500 National Guard members are expected to arrive to support the response and recovery efforts. Excessive rainfall amounts in some cases approaching 30 inches has caused significant flooding and flash-flooding. Major flood crests are expected on the Perdido, Blackwater, Shoal and Yellow Rivers according to the National Weather Service. Flood effects are expected by officials to affect thousands over the coming days.
Mississippi/Louisiana
Coastal areas of Mississippi and Louisiana also experienced seawater inundation due to storm surge. In the meantime areas near the shore of Lake Pontchartrain were also affected by flooding due to storm surge. Beaches, highways and low-lying properties were affected.
Georgia/Carolinas
One fatality was reported in Atlantic after a tree fell on a home. Heavy rainfall caused some flood impacts in portions of Georgia and the Carolinas.

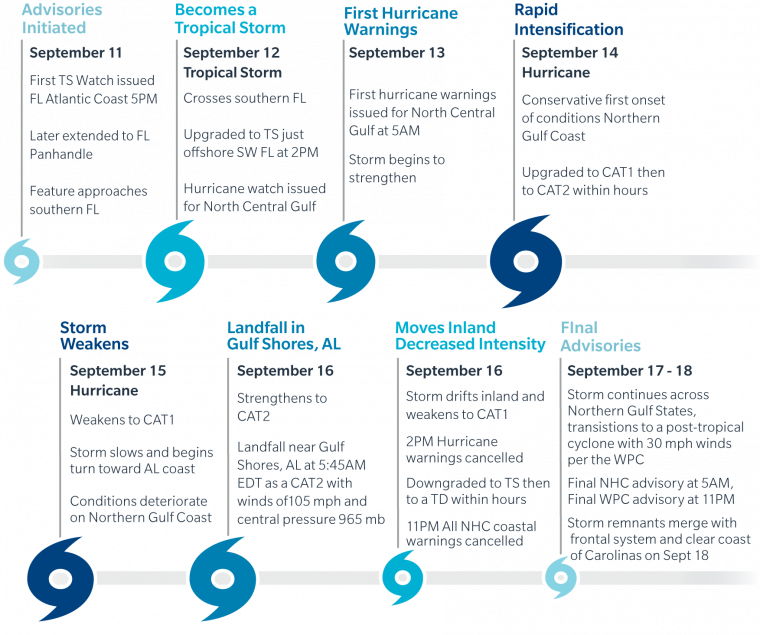
Key Dates in Timeline of Hurricane Sally (all times EDT)
Physical Discussion
The general timeline of Hurricane Sally is shown above, following advisories of the National Hurricane Center. Hurricane Sally was unique in several respects.
1) The earliest “S” named storm since 1950:
Since the practice of naming tropical storms and hurricanes began in 1950, this is the earliest “S” named storm to date. In 2005, Tropical Storm Stan was named by the National Hurricane Center on October 2. The 2020 hurricane season continues to set records with 22 named storms, 8 hurricanes and 2 major hurricanes. Hurricane Teddy threatens Bermuda as a major hurricane and possibly Atlantic Canada and New England early next week. Tropical Depression 22 now threatens interests in Texas and Mexico.
2) Yet another case of rapid intensification:
Between 5PM EDT September 13 and 5PM EDT September 14, Sally made a 40 mph gain in maximum sustained wind over a 24 hour period – a case of rapid intensification. This explosive gain in strength was enabled by very warm sea-surface temperatures, diminished wind shear and good storm ventilation from nearby upper-air features. The storm lost some strength after 11PM EDT September 14, weakening to a category-1 hurricane with winds of 80 mph due to cooler waters from upwelling and increased wind shear. This trend was reversed as the storm made final approach to the coast during the overnight hours, gaining strength as a 105 mph category-2 hurricane by 2AM EDT September 16, just a few hours prior to landfall at 5:45AM EDT.
3) Reduced forward speed brought forecast uncertainty, prolonged impacts, and excessive rainfall:
As Sally approached the northern Gulf, steering currents collapsed between two nearby areas of high pressure. The forward speed of the storm dropped to a crawl as a result, with an erratic direction. The forecast uncertainty increased as a result given uncertain timing and interaction with nearby features including a passing weather disturbance that would eventually draw Sally toward the coast. The slow movement of the storm also led to prolonged impacts including conditions of a category-2 hurricane, rainbands that were nearly stationary, and resulting rainfall accumulations approaching 30 inches with catastrophic flood effects.
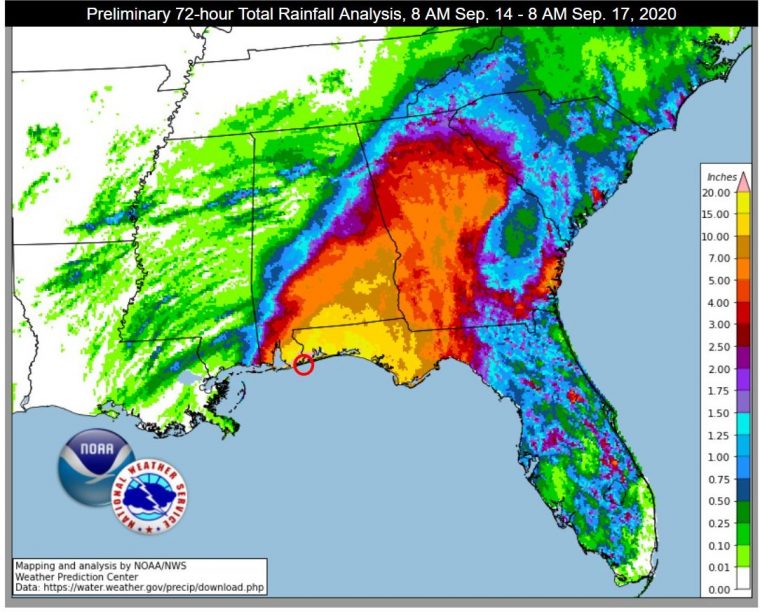
Estimated Rainfall Accumulation. 72 Hours Ending 8AM September 17. Source: NOAA/NWS.
4) Storm surge was higher than a typical category-2 hurricane:
The approach angle and slow forward motion brought significant coastal flood impacts over a long duration. In Louisiana, surge elevations reached over six feet above NAVD88 datum in Lake Borgne and over four feet above mean sea level along the southern shore of Lake Pontchartrain at New Orleans. As Sally made landfall just east of Mobile Bay, many gauges in Mobile Bay saw large drawdowns in surface water elevations. At the Coast Guard Station in Mobile, AL surge elevation reached a maximum of approximately 3.6 feet above NAVD88 Datum near 1PM EDT on September 15 with water levels then steadily dropping until they reached approximately 7 feet below NAVD88 Datum at approximately 9AM EDT on September 16. This brought an over 10 foot decrease in water levels over 20 hours. East of Mobile Bay in Alabama, surge elevations reached approximately 3.6 feet above NAVD88 Datum at Dauphin Island, which, if verified, would be the eighth highest observed water elevation at that location since 1966. Sally’s maximum surge elevation likely occurred on the Gulf side of Santa Rosa Island at Pensacola Beach, Florida however, no observations of high water have been made in the region as yet. Within Pensacola Bay, surge levels at downtown Pensacola reached approximately 6.5 feet above NAVD88 Datum which, if verified, would be the third highest observation at the location since 1923 following only Hurricane Ivan (2004) and an Unnamed category-3 hurricane in 1926.
5) Tornado threat:
The outer bands of Sally brought a considerable tornado threat as the storm moved ashore. Numerous tornado warnings were issued, and at least four tornadoes have been reported to date per the Storm Prediction Center.
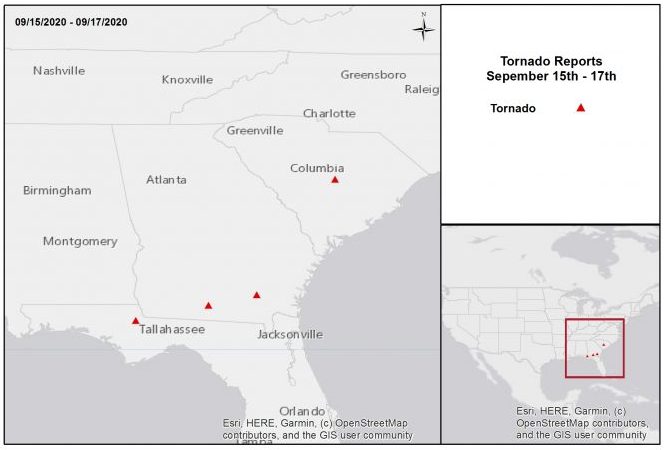
Tornado Reports September 15-17. Source: NOAA/SPC.
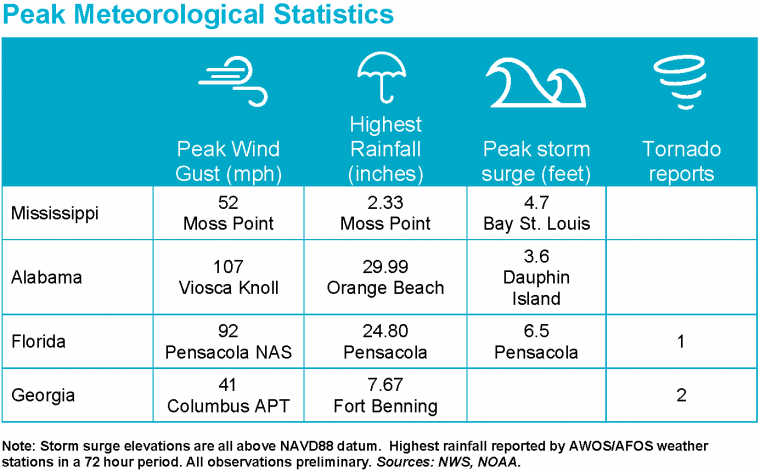
Sources: Reuters, The Weather Channel, Associated Press, BBC, U.S. National Hurricane Center, U.S. National Weather Service, U.S. Weather Prediction Center, U.S. Storm Prediction Center.