
- Biggest weather-related claims event on record, according to Insurance Council of New Zealand (ICNZ).
- ICNZ reported 20,000+ claims as of 3 February, more than any previous flood event.
- Worst-affected areas are northern regions of the North Island centering around Auckland City.
- Flood-induced landslide is a major sub-peril driving damages in this event.
The North Island Flood post-event report comprises the following sections:
- Meteorological Background
- Regional Vulnerability
- Damage Impacts
- Portfolio Properties in Flood Event
- Large Industry Insured Losses
Meteorological Background
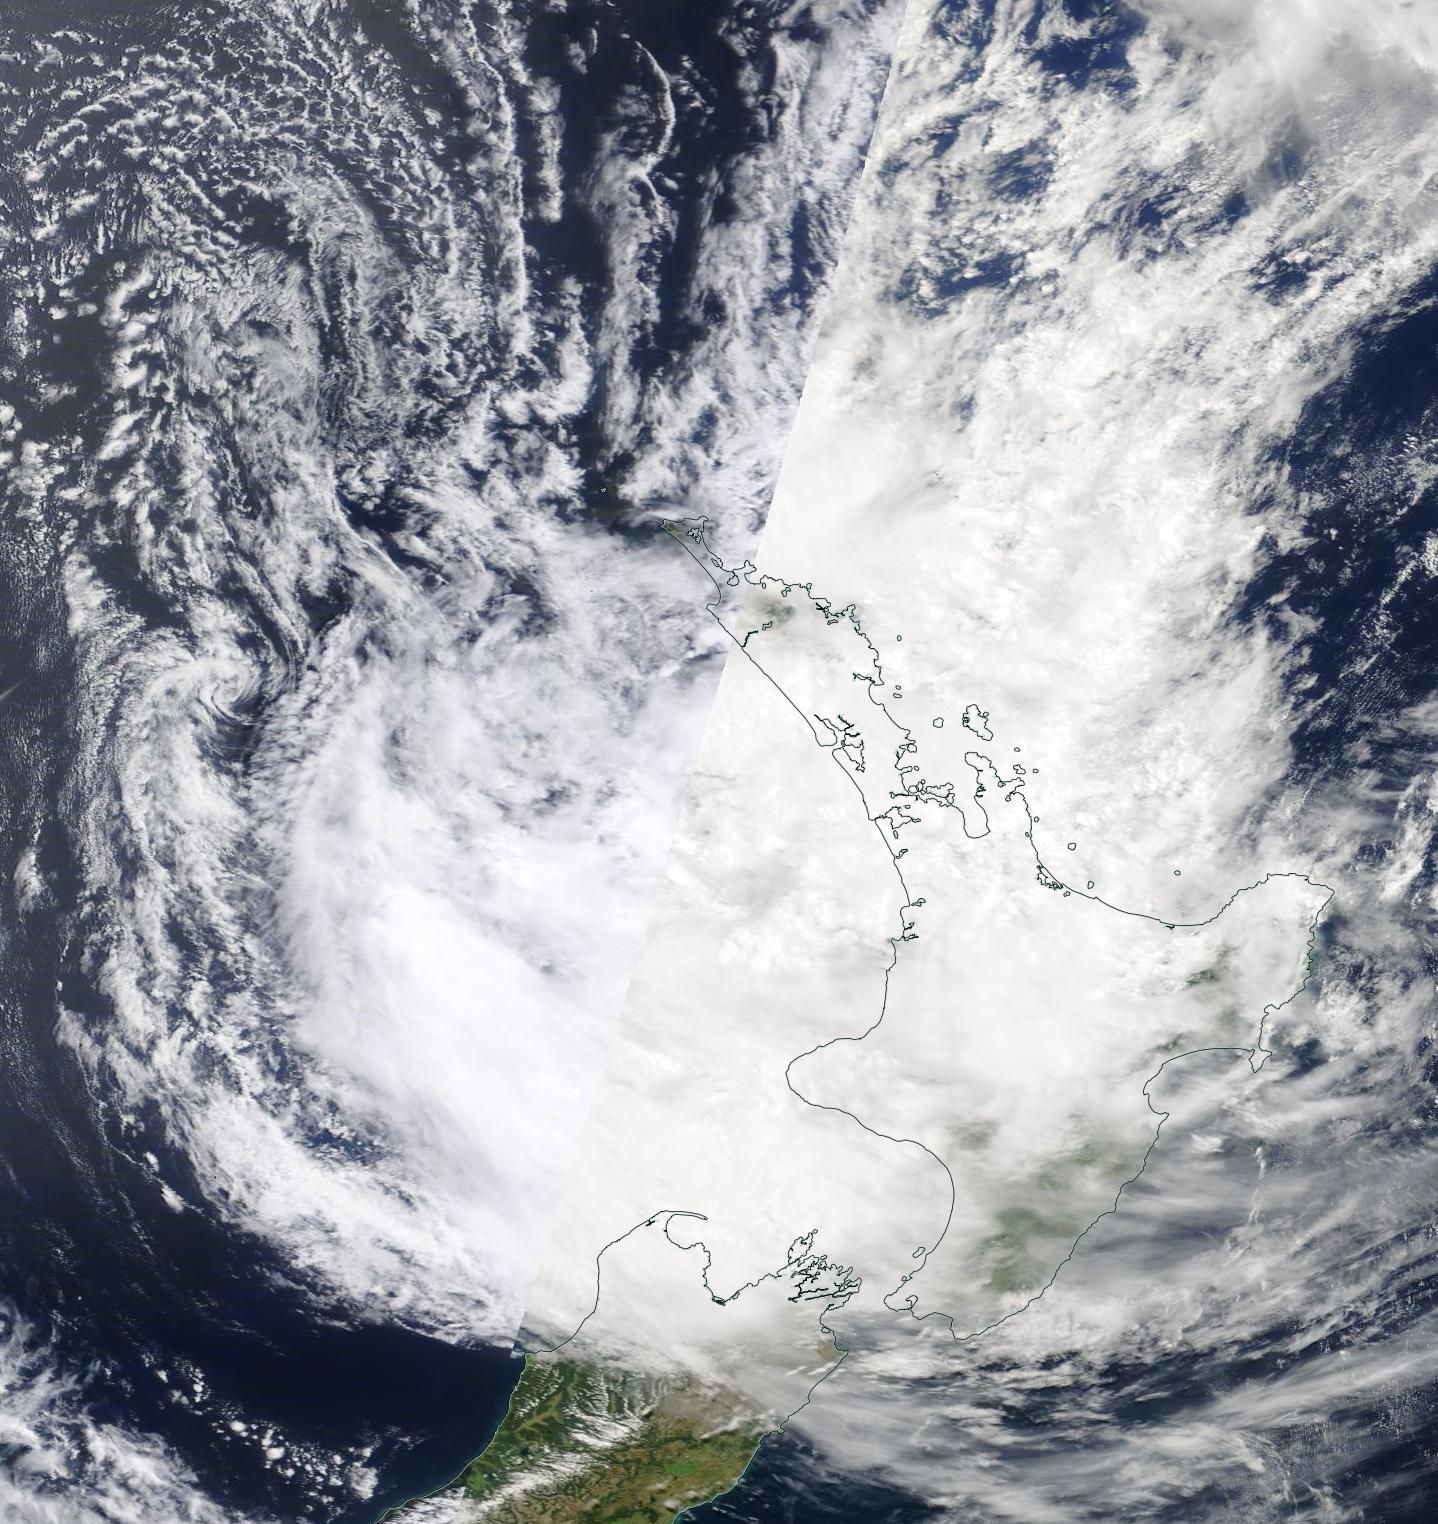
On Friday, 27 January 2023, torrents of thunderstorms associated with a low-pressure system hit Auckland. According to New Zealand MetService, the rainstorm set a new daily rainfall record of 245 mm (83.2 mm greater than the prior record for Auckland Airport weather station), as well as a new monthly record of 419.6 mm (115 mm more than the previous monthly record, July 1998). Stations across the city also have experienced 250-300 mm rainfall in 1½ days, with peak hourly rainfall of 60-80 mm per hour. Such an unprecedented amount of rain triggered significant flooding across the country’s largest city. The weather patterns that produced heavy rainfall are shown in Figure 1.
Figure 1: Surface winds (arrows), precipitation (shadings), and mean sea-level pressure (contours) 12:00 NZT, 27 January 2023.

Source: ECMWF Reanalysis 5 Graphics; Guy Carpenter
Recent ocean-atmosphere conditions increased the destructive potential of the low-pressure system. Prior to the event, January 2023 already had been very wet for the North Island. The 2022-23 summer experienced the third La Niña in a row, a climate state that pushes warmer ocean water toward the western Pacific. Cyclonic circulation became more common in the Coral Sea, driving more moist warm air toward New Zealand. Furthermore, the country experienced 3 back-to-back record warm winters since 2020, as well as 2 record-setting warm years (2021 and 2022). Since warmer air can carry more moisture and warmer sea water evaporates more water into the air, the recent state of the climate likely intensified the low-pressure system as it headed toward land. Some cities experienced extreme rainfall during this period. Below are some examples.
Table 1: Examples of Extreme Rainfall Events Since 2020

According to the latest Intergovernmental Panel on Climate Change (IPCC) report on physical science, a warmer climate increases the supply of moisture to weather systems, intensifying heavy rainstorms at a rate of 7% per 1 degree Celsius. New Zealand MetService reported that climate change intensified the rainstorm responsible for Canterbury Flood in May 2021 by 10%-15%. Warming temperatures thus may have contributed to the intensity of the latest event.
Regional Vulnerability
The Auckland area has many steep hillside slopes with clay-rich soil, which does not drain well. Once the soil is saturated, the weight exceeds a certain threshold and landslides occur. If a property is built without a sufficient setback from a cliff, then it may find itself teetering on the edge or toppled over by a landslide. Instead of damage resulting from disappearing land from below, a property also may be damaged by an avalanche of water-laden soil, tree debris and boulders from above. Surveys must carefully consider the geology of the land before (re)building in this environment.
Urban growth in the Auckland region, with increasing numbers of roads and buildings, has decreased the amount of permeable land surface, making it more challenging to discharge water effectively with the current network of basins and storm-water drainage systems. In addition, torrential rainfall carries debris that clogs street gutters and floods streets, and downpours can overwhelm the drainage infrastructure and cause catastrophic losses.
Damage Impacts
Although the Auckland region experienced the greatest damage, nearby areas also were affected. The city of Auckland accounts for more than one-half of New Zealand’s population, and the greater Auckland region contributes more than one-third of national GDP. This extreme event not only brought inundation for many properties in the region, but also caused significant damage from landslides, disrupting transport to and from this key economic area.
Major Locations Impacted by Flood
Many homes lost power and water. School closings have been extended to 10 February in the affected areas. The international terminal of the Auckland Airport was inundated, and the Auckland District Court flooded. Several sports stadiums also were flooded, and 2 shows by Elton John at Mount Smart Stadium had to be cancelled. Up to 10 wagons carrying logs on a KiwiRail freight train derailed near Te Puke in the Bay of Plenty. Numerous streets were flooded and several bridges washed away, making rescue and recovery efforts very challenging. Below is a map of the hardest-hit areas.
Figures 2 and 3: Map of the worst affected areas across the North Island (left) and the inset showing the worst-affected suburbs in Auckland.

Source: Guy Carpenter / media articles
The event affected large parts of the Auckland, Waikato, Coromandel, Bay of Plenty and Gisborne regions from the 27 January 2023 onward. In Auckland, there were reports of damage across many suburbs, with the worst-affected areas around Auckland Airport, Auckland CBD, Wairau Valley, Hillsborough, Massey, Stanley Point, Northcote Point and Greenlane.
Major Locations Impacted by Landslides
The event also resulted in several landslides across Auckland and Tauranga, causing many properties to be red-stickered, because they had become unsafe to enter and/or uninhabitable. Other properties were yellow-stickered, with access restricted to only certain parts of the buildings, or limited to a short time to remove valuables.
The largest landslide resulted in the closure of part of State Highway 25A, that links the east and west of the Coromandel Peninsula. The local tourism industry is particularly concerned because the repair will take months.
Many other landslides carried homes with them or dumped debris on homes below. They also left large amounts of debris on roads, disrupted traffic, and made travel hazardous. Certain roads have been cordoned off for safety.
Figure 4: Map of streets affected by landslides in Auckland

Source: Guy Carpenter / media articles
Surveyors have begun assessing property safety for inhabitants regardless of the likely cause (flood or landslide). As of this writing, about 5,000 properties have been assessed and assigned coloured stickers. As noted above, a red sticker means the property is not safe for entry, whereas a yellow sticker means there is permission to enter only a certain part of the property or to enter temporarily to remove items. Figure 5 shows the locations (and sticker colours) of assessed properties around Auckland.
Figure 5: Assessed Properties

Source: ICNZ
Portfolio Properties in Flood Extent
Guy Carpenter has undertaken portfolio mapping for several areas across Auckland based on flood extents provided by GeoSpatial Insight (GSI). These flood extents attempt to capture damages from only pluvial flooding, and not from wind, rainwater and/or water ingress. Figure 6 highlights the properties in the flood extents for a sample portfolio.
Figure 6: Portfolio Properties in Flood Extents

Source: ICNZ
Large Industry Insured Losses
According to the latest estimates from the Insurance Council of New Zealand (ICNZ), the recent North Island flood is likely the country’s largest-ever non-earthquake event in terms of insurance, surpassing Timaru Hail Storm’s NZD 170 million. The table below presents historical flood events with the largest insured loss amounts.
Table 2: Historical Flood Events with Large Insured Losses

Source: ICNZ, as of 3 February 2023
The recent event will add to inflationary pressures in New Zealand’s domestic economy, especially relating to rent, construction and food (since the country will need to increase imports to replace crop losses). Furthermore, the global market for automobile parts is already under stress, and the sudden increase in demand for imported repair parts and new vehicles, combined with delays in repair and replacement, will lead to overall increases in claim costs.
One special coverage benefit from New Zealand’s Earthquake Commission (EQC) EQCover is that it pays for qualified residential land damage caused by storms and floods. Therefore, the recent event will be insured by both the private market and EQC.
As of this writing, the largest affected insurer, Australia’s IAG, received more than 15,000 claims across its insurance brands, AMI, State and NZI . Another Australian insurer, Suncorp, received more than 8,000 claims through its Vero and AA brands. Local insurer Tower received more than 4,800 claims. All together, this gave a total of slightly less than 28,000 claims.
All three insurers disclosed that their losses from this event are eligible for recovery from reinsurance programs. The increased frequency and complexity of pluvial versus fluvial floods and associated landslides make it more challenging and expensive to obtain lower-layer and aggregate protection. Other reinsurance solutions may need to be considered—such as structured and parametric arrangements—to complement traditional coverage if retentions increase because of price and availability pressures.
Sources: New Zealand Herald, Sydney Morning Herald, Stuff, Reuters, Newshub, Artemis, The Conversation, ourAuckland, Informetrics, Earthquake Commission (EQC), Meteorological Service of New Zealand (MetService), Insurance Council of New Zealand (ICNA), European Center for Medium-Range Weather Forecasts (ECMWF), National Institute of Water and Atmospheric Research (NIWA), Radio New Zealand, Intergovernmental Panel on Climate Change (IPCC).