

Summary
- The 2024 North Atlantic hurricane season is expected to be very active according to seasonal outlook providers. Predictions sit above average for the period of elevated activity from 1995-2023, and well above average for the longer 1950-2023 period.
- Factors in play include very warm sea-surface temperatures in the Atlantic Main Development Region, developing La Niña conditions and elevated activity in western Africa.
- Hurricane landfalls vary substantially from year to year relative to activity in the Atlantic Basin including the Gulf of Mexico. This depends on daily weather patterns and related steering currents. Weather prediction for any event generally loses skill beyond a 7-10 day forecast lead making seasonal landfall predictions a challenge.
- Interests in property (re)insurance should be prepared as always for impactful hurricane landfalls regardless of seasonal outlooks for the basin. For those seasons with 10 or more hurricanes, we have seen a wide range of insured losses, ranging from under USD 1 billion to over USD 100 billion.
Discussion
Seasonal Outlook Summary
Seasonal outlooks for the 2024 North Atlantic Hurricane season are shown in Table 1 below, from:
- National Oceanic and Atmospheric Administration (NOAA)
- UK Met Office (UK Met)
- Colorado State University (CSU)
- The Weather Company (TWC)
The 1950-2023 average represents a longer-term period where hurricane detection in the Atlantic Basin includes overflight data and then satellite data from about 1970 onward. The 1995-2023 average reflects the current active period of Atlantic hurricane activity that began around 1995.

Sea-Surface Temperatures in the North Atlantic
Sea-surface temperatures are well above average for the Atlantic Main Development Region as shown in Figure 2 below (circled area to the east). Some areas already have set records for May and forecasts show the potential for the warmest temperatures in recorded history for portions of the Atlantic. With all else equal, this would be associated with elevated tropical activity in the Atlantic Basin. Elevated sea-surface temperatures in the far west tropical Atlantic and Gulf of Mexico can also enhance the potential for sudden development “in close” to the mainland.
Developing La Niña
The tropical eastern Pacific is becoming cooler than average, consistent with a developing La Niña pattern as shown in Figure 2 below (circled area to the west).

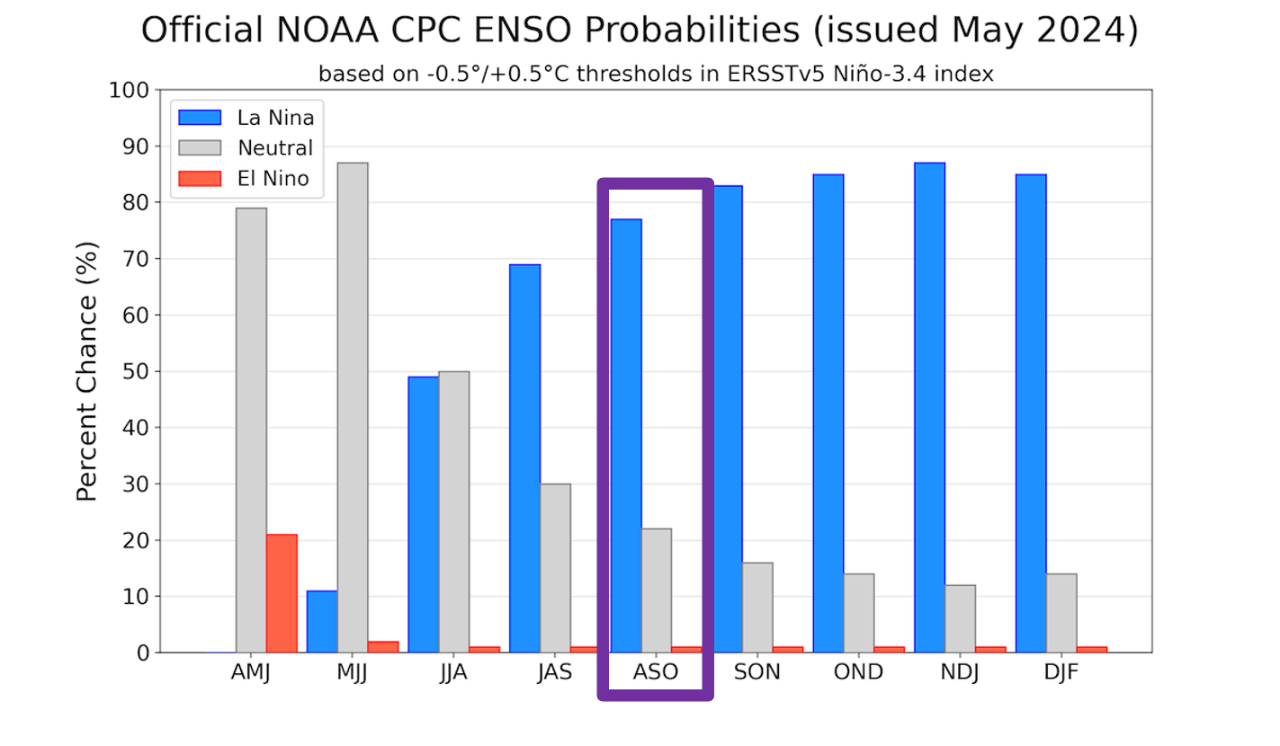
Under La Niña conditions, we typically see elevated hurricane activity in the North Atlantic Basin due to reduced wind shear. Wind shear is a change in wind speed with height and can disrupt storm development like a Jenga game under a leaf-blower, and La Niña is shown to reduce these effects to enable hurricane development. For the heart of hurricane season from August to October, La Niña conditions are most probable according to the NOAA Climate Prediction Center as shown in Figure 3 below. With all else equal, this would bring elevated activity for the season.
Putting the Pieces Together
The complementary factors of warm waters in the Atlantic and the developing La Niña in the Pacific lend higher confidence in elevated activity for 2024. In the meantime, indications are for elevated West-African monsoon activity, which can produce more disturbances acting as seed storms for hurricane development. Some remaining points of question include the onset time of the La Niña circulation this summer and the timing and aggressiveness of West-African monsoon activity.
Predictions of basin activity have some measure of skill over climatology alone. For example, the Colorado State University seasonal outlooks show a correlation between basin predictions and observations of 0.49 for the April outlook, with improvement to 0.63 and 0.81 for the June and August predictions, respectively (using a 2014-2023 baseline). These outlooks do show some surprises from season to season, noting the forecast challenges of 2013 with 9 predicted hurricanes versus 2 observed, or 2005 with 7 predicted and 15 observed.
Analog Seasons
Analog seasons which most closely match expectations for 2024 include 1926, 1998, 2010 and 2020, according to the seasonal outlook from Dr. Phil Klotzbach of Colorado State University. These seasons produced a range of activity from 8-14 hurricanes and 2-7 major hurricanes. In particular, the 2020 hurricane season produced six landfalls on the Continental U.S., while the 2010 hurricane season saw twelve hurricanes in the basin and among the most active on record, but without a single hurricane landfall on the Continental US.
What About Landfalls?
Along these lines, the Continental US landfall-to-basin ratio shows considerable volatility on an annual basis. Hurricane landfalls depend on how close the hurricane is to land, along with weather patterns and associated steering currents. Neither of these are reliably predictable on long timescales beyond 7-10 days, and even 72 hours can be a challenge in some cases. The landfall to basin ratio for the Continental US is shown in Figure 4 below, with a range between 0 and 86 percent for the post-satellite period (and best detection capability).

What Does This Mean For Insured Losses?
Insured losses are determined by landfall or close-approach of a named storm, where it hits, how strong it is at landfall, what properties are affected, hazards in play including wind storm surge and rainfall, local geographical effects, construction characteristics and policy terms (to name just a few). While perhaps a very rough indicator of directionality, hurricane activity in the basin is not a reliable predictor of seasonal insured loss, with considerable spread between seasonal insured loss and number of hurricanes in the basin as shown in Figure 5 below.

We can explore the range of insured loss for the busiest hurricane seasons, using the historical record for 1950-2023 (well into the aircraft reconnaissance era and including the satellite period with more reliable detection). We find 9 seasons that produced 10 or more hurricanes over this period. Industry insured loss for these 9 seasons ranges from under USD 1 billion to over USD 100 billion as shown in Table 6 below.
It is apparent that active hurricane seasons can produce industry insured losses which are quite severe. We have seen such seasons before, and we will see them again. It is also quite apparent that we will not see such severe losses every time, noting only 2 seasons out of 9 reaching the landmark scale of 2005 and 2017. We also see years in the mid and lower ranges of insured loss activity, noting the landmark 2010 season with 12 hurricanes in the basin but no hurricane landfalls on the Continental US. We have seen seasons on the lower end of the insured loss range before, and we will see them again.

Contact
James Waller, PhD
Research Meteorologist, Guy Carpenter
James.Waller@guycarp.com