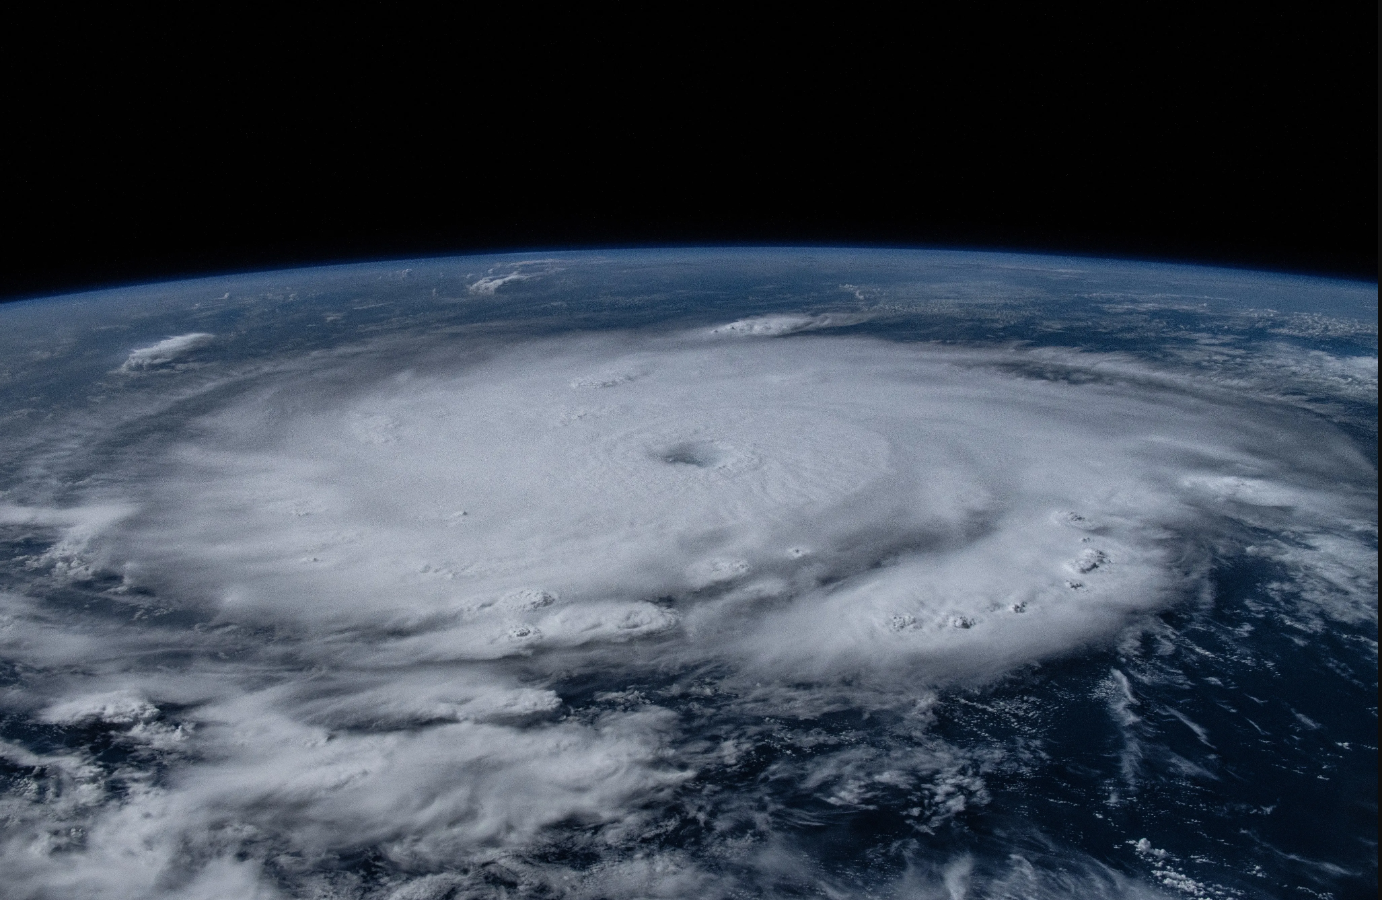
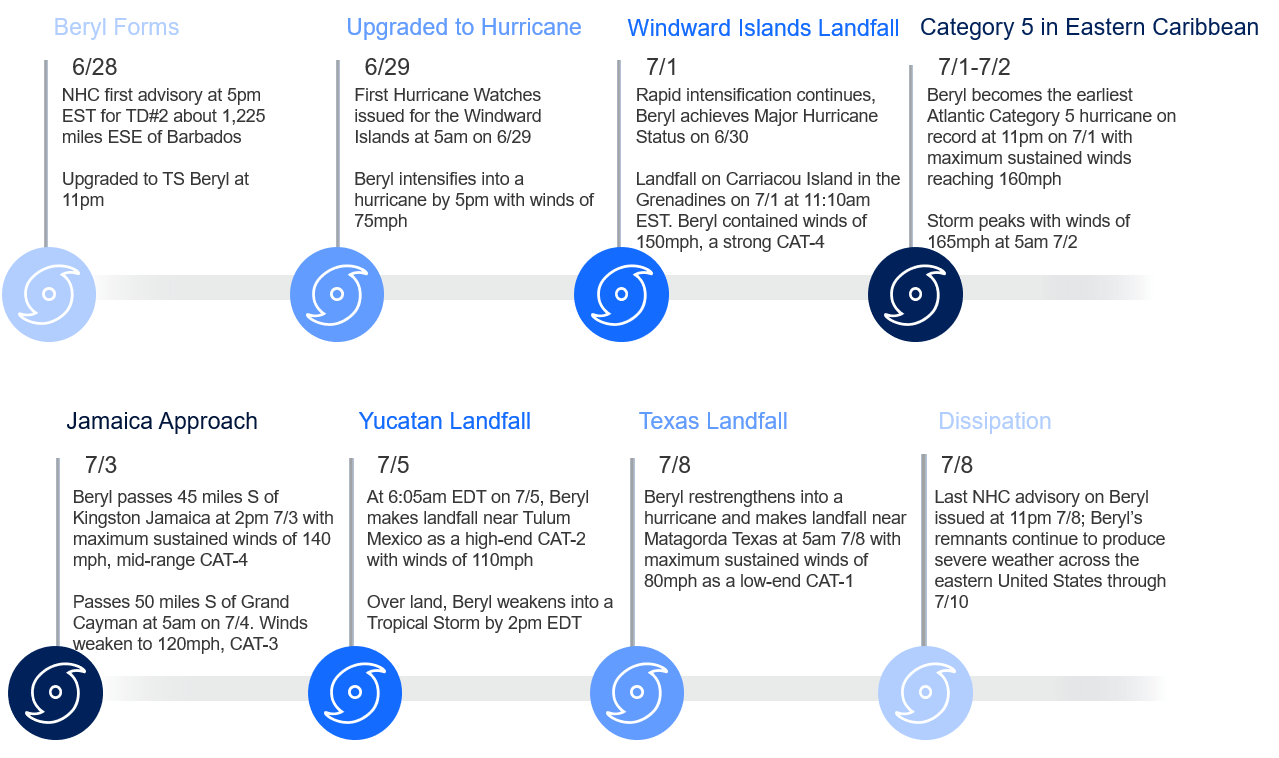
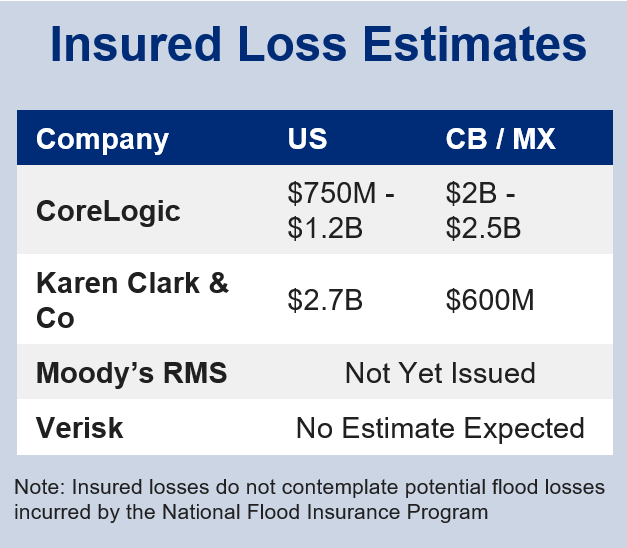
Hurricane Beryl was the earliest Category 5 hurricane on record in the Atlantic basin. After bringing severe damage to the Windward Islands and southern Jamaica, Beryl weakened to a Category 2 hurricane while crossing the Yucatan Peninsula. Beryl went on to make a Category 1 landfall along the central Texas coast, with widespread flooding and tornado activity extending from the central to northeast US. Significant flooding in the Houston, Texas, metro region, coastal Texas wind damage, and multiple US communities impacted by tornadoes are leading US loss drivers. Publicly issued insurance industry loss estimates range from USD 2.5 to 4.0 billion.
A Hurricane for the Record Books
Earliest Category 5 in Atlantic History
Record daily high ocean heat content in the tropical Atlantic, coupled with ideal atmospheric conditions, resulted in several new records. Beryl was the earliest Category 4 and 5 hurricane in the Atlantic, surpassing Emily in 2005 reaching Category 5 status by more than 2 weeks. Beryl also joined three other hurricanes that intensified from a tropical depression to Category 4 strength within 48 hours (Keith 2000, Wilma 2005, Delta 2020).
Figure 1: Category 5 Hurricane Beryl west of the Leeward Islands.
Source: NOAA, RAMMB-CIRA
Damage Across the Windward Islands
Significant damage has been reported throughout the Grenadines, Grenada (particularly Carriacou and Petite Martinique), Barbados and Tobago. In a press conference, Grenada Prime Minister Dickon Mitchell quoted “widespread reports of destruction and devastation in Carriacou and Petite Martinique,” going on to say, “in half an hour, Carriacou was flattened.” Extensive storm surge and significant building damage, including roof loss, has been reported across impacted islands, and electricity and water infrastructure is severely damaged. Officials estimate nearly 90 percent of homes damaged or destroyed on Union Island of Saint Vincent and the Grenadines. Situational updates on recovery are available through the Caribbean Disaster Emergency Management Agency.
Close Approach to Jamaica and Insurance Implications
Heavily impacted southern coastal areas of Jamaica are also reporting scarce resources for water and food along with heavily disrupted sanitation and electrical infrastructure. While significant damage was confined to the southern half of the island with a population of 2.8 million people, fortunately the core of strongest Category 4 strength winds remained just offshore.
Figure 2: Jamaica Situation Overview as of July 10, 2024
Source: Relief Web
From an insured loss perspective, the near miss resulted in the failure of a USD 150 million catastrophe bond to trigger as central pressure over the island failed to reach the level required for a payout. The 2024 World Bank associated bond, sponsored by 15 global investors, was a 4-year renewal of the original 2021 placement, providing coverage for severe hurricane damage. The Jamaica Ministry of Finance has an additional USD 1.6 billion of additional risk financing to cover major natural disasters, including a USD 16.3 million payout from the Caribbean Catastrophic Risk Facility.
Beryl’s Impacts for the United States
Comparing Beryl to Other Notable Texas Landfalling Hurricanes
After causing minimal damage across the central Yucatan Peninsula as a landfalling Category 2 hurricane, Beryl emerged into the Gulf of Mexico and regained hurricane status just before landfall at Matagorda, Texas. Progressing northward, Beryl tracked directly over Harris County, Texas. Only 5 hurricanes since 1960 have tracked within 30 miles of the county seat of Houston, most recently Nicholas (2021) and Ike (2008). Alicia (1983) was the strongest landfall at Category 3 strength. Wind damage was reported on the Texas coastline, yet the largest story was widespread coastal and rainfall-induced flooding across the Houston metro region, resulting in 2.5 million customers without power. Houston has experienced several devastating flood events from tropical cyclones, most notably Hurricane Harvey (2017) and Tropical Storm Allison (2001). As seen in the chart below, most of the statistics associated with Hurricane Harvey are more impressive than Beryl, yet power outages were significantly higher in Beryl. Peak wind gusts of 90 mph in Houston with Beryl resulted in widespread treefall, exasperating the magnitude of power outages.
Figure 4: Comparison of Hurricane Harvey and Beryl
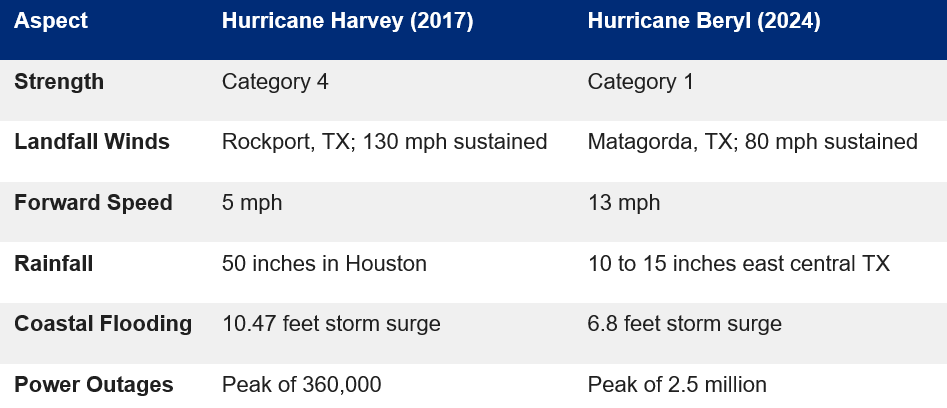
Source: Guy Carpenter
Major Tornado Outbreak
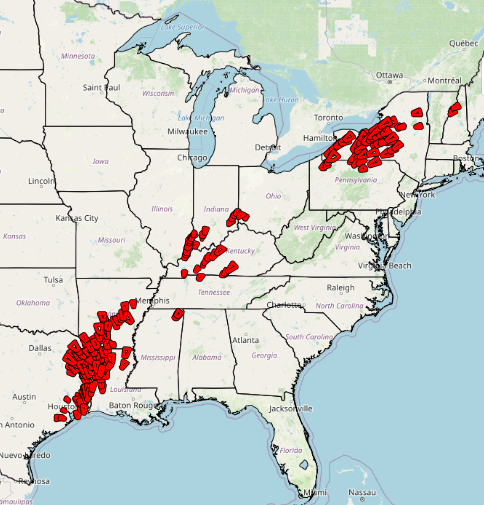
Well away from landfall, a major tornado outbreak associated with Beryl’s transit across the lower 48 US states as a transitioning tropical to extratopical storm was highly impressive. To the east of Beryl’s inland progression, an environment conducive to tornadic development was in place; high levels of atmospheric instability promoted ongoing severe thunderstorm development and shifting winds with height helped to induce rotation within these storms. Beryl has helped to grow the 2024 national tornado count as the most active year since 2011.
Figure 5: Tornado warnings
Source: SPC, Guy Carpenter
Tornado Statistics
- Over 200 tornado warnings were issued with 50 reports of a tornado on the ground
- As of publication, at least 28 tornadoes spanned from Texas to the Northeastern US have been confirmed by the National Weather Service.
- An EF-3 tornado that struck Mount Vernon, Indiana, was the strongest observed.
- The last landfalling hurricane to see this level of tornado activity was Hurricane Ivan (2004)
- The National Weather Service Office in Shreveport, Louisiana, issued an all-time daily office record of 67 tornado warnings on July 8.
Figure 6: Insured Loss Estimates
Source: KCC, CoreLogic
How Does a Changing Climate Relate to Beryl?
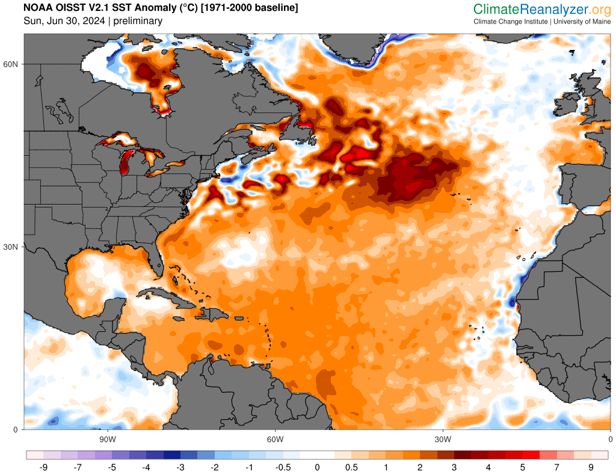
Atlantic ocean temperatures have been at or exceeding record warm levels since March 2023. A warming planet sees up to 90% of excess heat stored in oceans. The energy source for hurricanes are warm sea surface temperatures.
Exceptionally warm oceans provide extra fuel for tropical systems by which they can intensify rapidly. Beryl intensified from a tropical depression to a Category 4 storm in 48 hours, an increase of 65 mph. This has only been accomplished by three other hurricanes.
Warming oceans are one of the primary contributors to sea level rise, increasing the likelihood of high storm surge events. Beryl was the fifth-highest storm surge for Galveston Bay, with only Category 1 winds.
Due to a warming atmosphere and ocean, the level of moisture availability for heavy rainfall is higher. Widespread flooding in Houston was also accompanied by 8-10” totals as far away as Indiana, Michigan, Vermont and Maine.
Figure 7: Sea surface temperature anomalies
Source: Climate Reanalyzer, University of Maine
What Does Beryl Imply for the Active Seasonal Outlooks?
Aggressive Seasonal Forecasts Continue
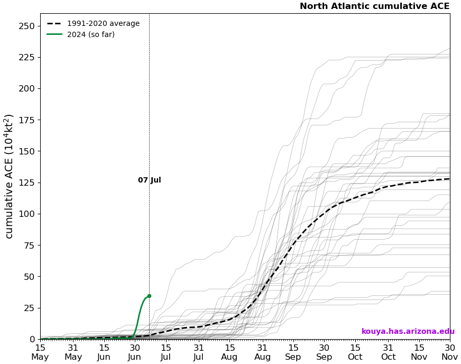
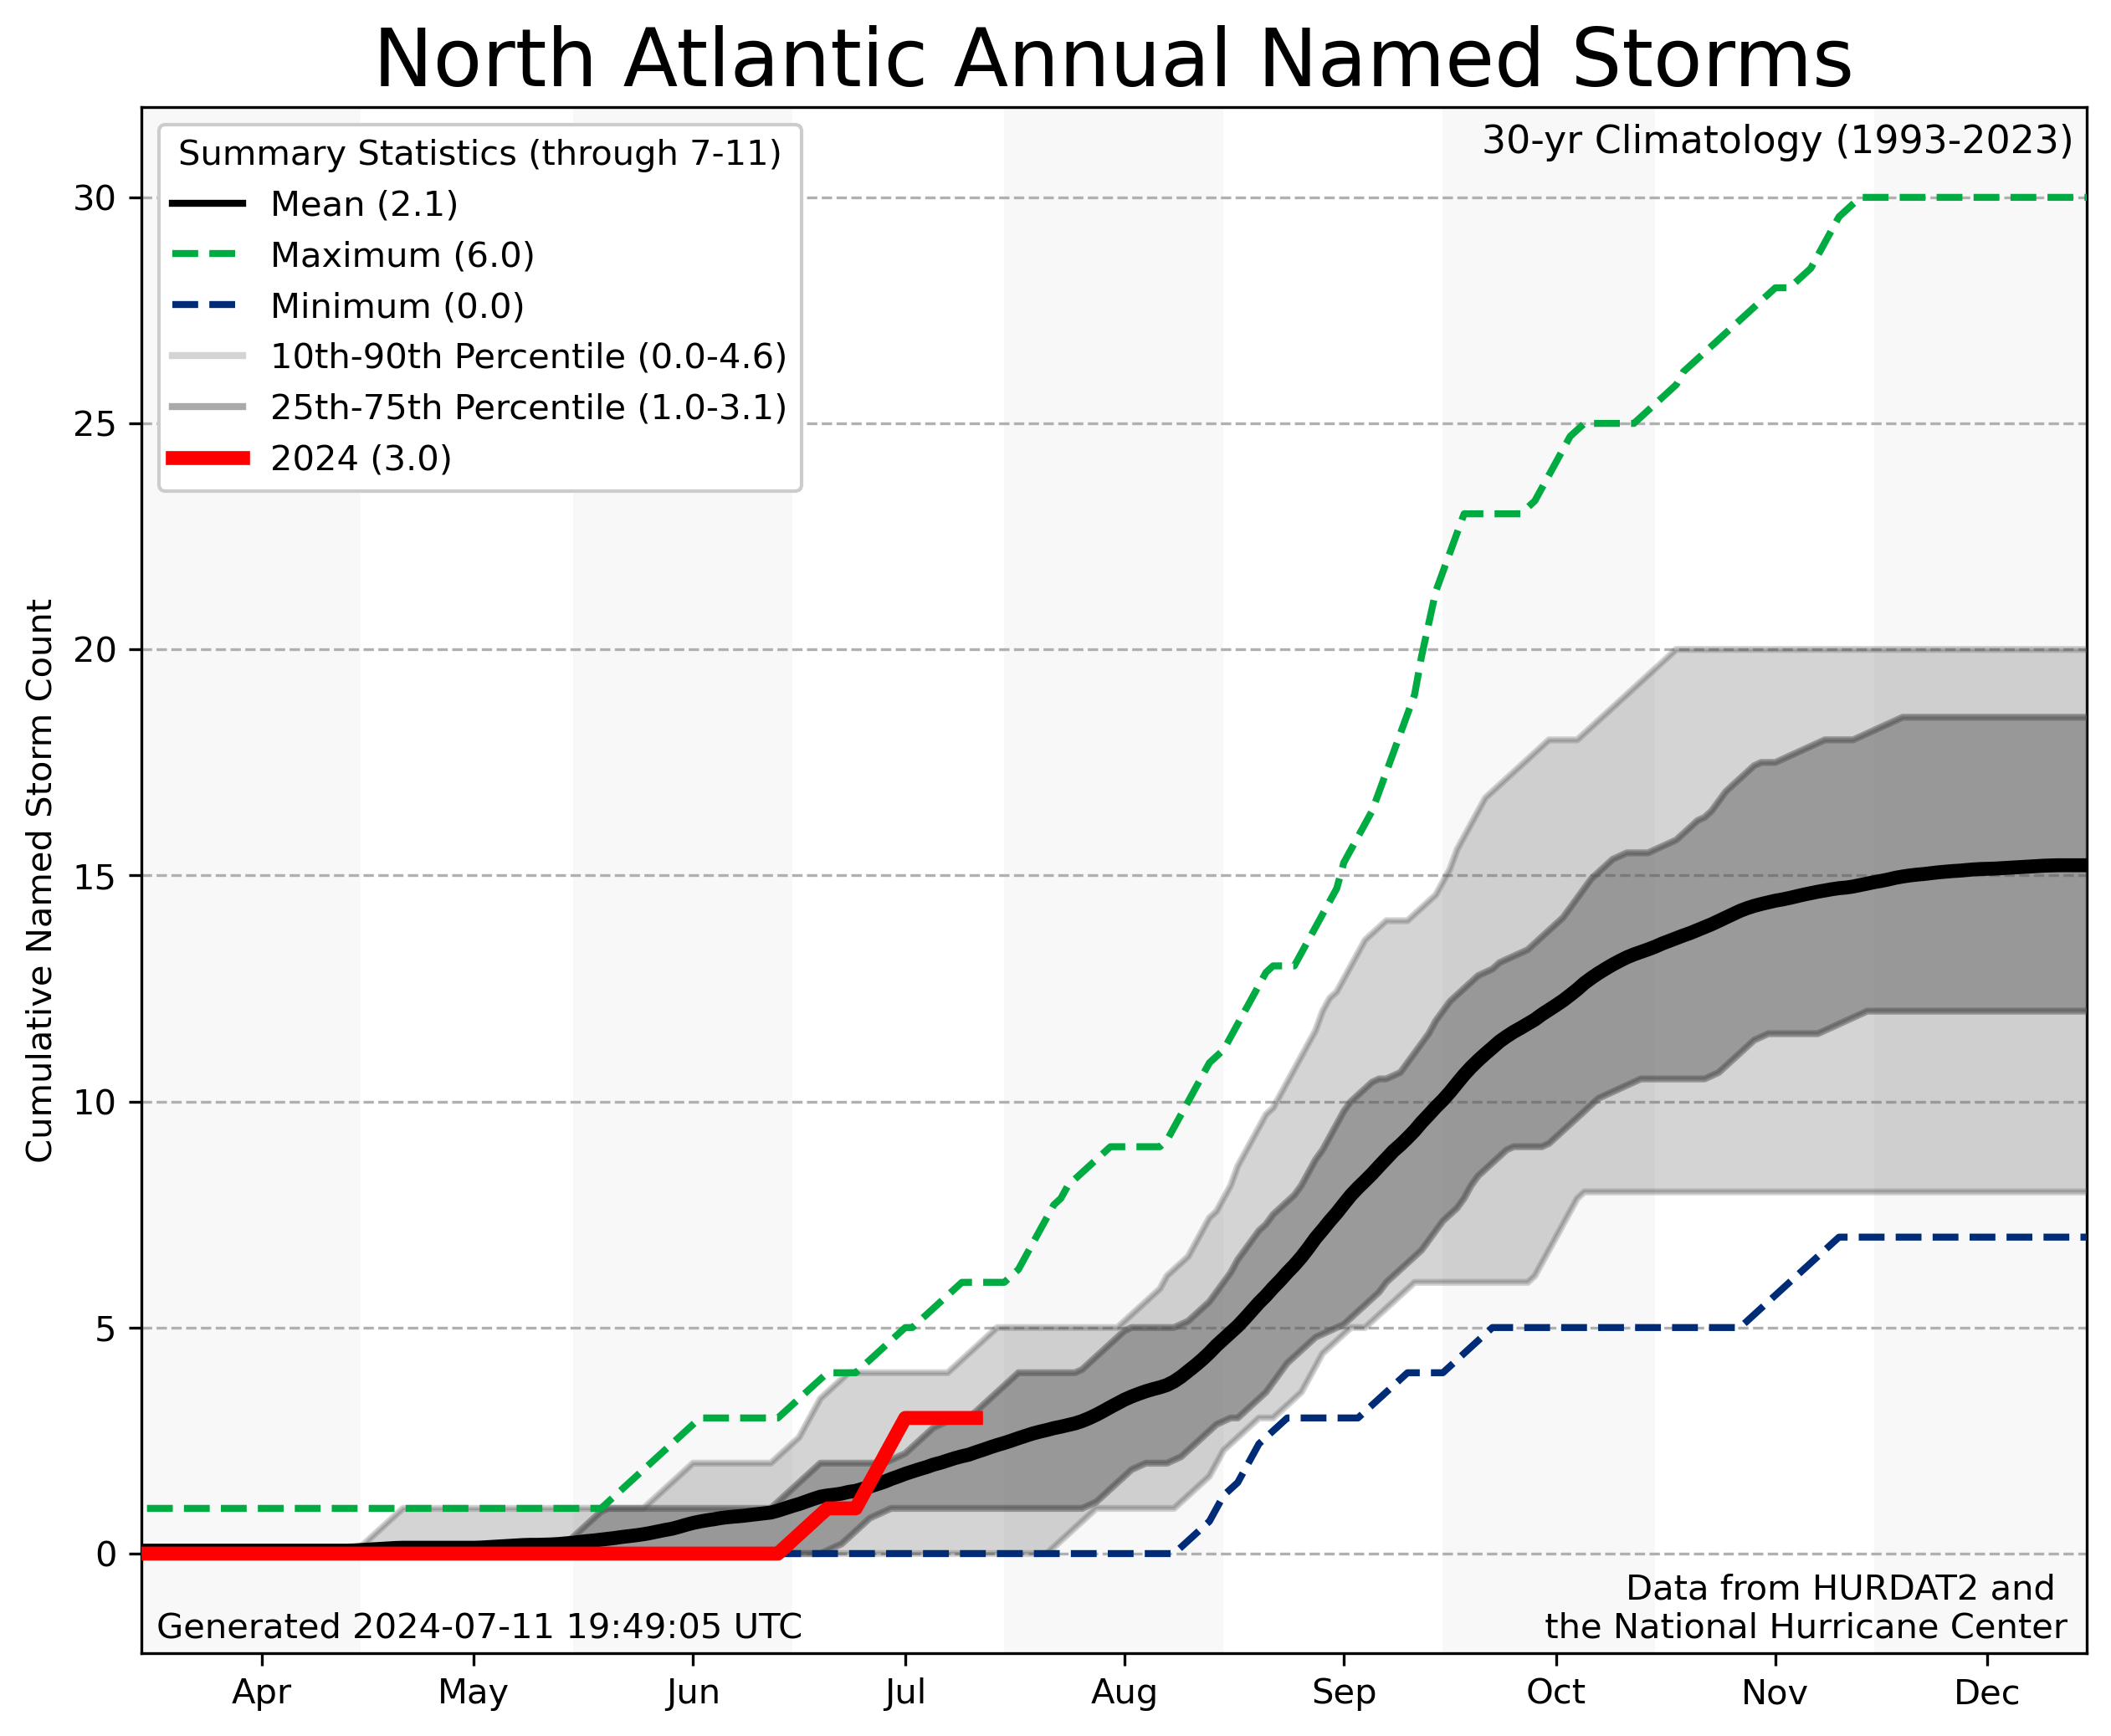
Recently issued seasonal forecasts have further increased projections for above-average storm countand accumulated cyclone energy (ACE), a metric that accounts for tropical cyclone intensity and duration. Hurricane Beryl’s early formation and record intensity does not guarantee that these forecasts will verify, though the storm has contributed to above-average storm count and record early ACE. It is challenging to predict if continued high levels of activity will lead to more landfalling storms as transient weather patterns are a dominantfactorin determining if a storm will impact the coastal regionsof the Atlantic.
Figure 8: Accumulated Cyclone Energy 2004 vs All Years Since 1990
Source: Dr. Kimberly Wood, University of Arizona
What’s Next for the Season?
Over the next few weeks, the Atlantic basin appears to be entering a more unfavorable period for tropical cyclone development. While ocean temperatures will remain well above average across the Atlantic basin, large outbreaks of dry air from the Saharan Desert will act to suppress thunderstorm activity in the second half of July. In addition to the drier environment, unfavorable upper-level winds will act to impede storms from trying to organize. The season does appear ready to pick back up in early August however, as global circulation patterns are projected to align in a favorable configuration for another bout of heightened activity.
Figure 9: Cumulative 2024 Storm Count Against Average
Source: HURDAT2, Guy Carpenter