Header

GC AdvantagePoint®

GC AdvantagePoint

Companies looking to respond faster to catastrophe events, underwrite more profitably and create robust portfolio management strategies can leverage the power of GC AdvantagePoint®, our catastrophe analytics platform.

The platform's applications bring new technology to improve the performance and efficiency of underwriting and catastrophe management workflows. It delivers new technology, insights and greater efficiency to carriers seeking to modernize their approach to managing catastrophe risk.

Manage Volatility Caused by Extreme Weather to Improve Loss Ratios

The frequency of severe weather events including severe convective storms and wildfires prove to be a consistent loss driver for businesses. Manage your exposure to this wider range of perils.

Guy Carpenter helps clients effectively manage secondary perils through a combination of data-driven risk assessment capabilities, thorough evaluation and validation of vendor catastrophe models, and educational initiatives focused on mitigation and resilience. 

GC AdvantagePoint Core Applications

  • EVENT IMPACT:

    Delivery of critical, proactive insights on the impact of real-time events on your in-force portfolio as they unfold. A suite of live event data feeds, customizable email alert notifications, and a dashboard driven interface help claims managers expedite resource planning, pre-event impact assessment and post-event claims management.

  • UNDERWRITER+:

    Underwrite prospective risks with confidence. Our platform delivers actionable risk information to underwriters at the point-of-sale to guide improved risk selection and increase profitability. Accumulation, hazard and other modeled loss metrics are delivered on-demand and available via API services.

A suite of applications live on the platform and are rooted in geospatial technologies and insights. The platform supports a range of use cases from underwriting to catastrophe response to portfolio management.

Shannon Peterson, Head of Global Analytics Product Management

Key Benefits

  • Cutting Edge Technologies

    Built on an ultra-scalable geospatial foundation for creating map visualizations, analyzing event layers and interacting with your in-force portfolio data. New custom tools and filtering make it easier than ever to analyze your data.
  • Proactive Insights

    Timely email notifications with customizable perils, alert triggers, and email recipients delivery damage factors deliver proactive event insights. Live event dashboards offer both location and business intelligence details.
  • Comprehensive Event Data

    Support for thousands of archived event footprints, access to third party datasets, and streamlined event layer onboarding to deliver the data you need. Historical data catalog supports intuitive search, sort and filter capabilities to find event layers quickly.
  • Visualize the Risk

    Access to an extensive catalog of global hazard layers across a range of natural and man-made perils. Fully customizable set of hazards can be returned in addition to corporate underwriting guidelines.
  • Avoid Large Concentrations

    Evaluate and visualize the relative concentration of in-force exposure within a select distance from the prospective risk. Quickly calculate exposure across multiple distances and view the details of nearby in-force policies.
  • Improve Pricing Adequacy

    Fully customizable data entry forms available to design underwriting inputs by peril, region, product or line of business. Support for Verisk and RMS models, including marginal metrics.
  • Your Data, Your Control

    Data can remain in the system for as long as needed. Using our on-demand upload process, users can load data directly into the system. The upload process is flexible to allow for various types of data such as portfolio locations, claims data and agency locations. Data may also be loaded by Guy Carpenter’s Cat Modeling team.
  • Unlimited Users

    There is no limitation to the number of users, allowing for team collaboration.

Floods and GC AdvantagePoint

Flooding is the most pervasive and damaging climate risk throughout most of the world, posing an ever-increasing threat. This year alone, we have seen the damage caused by the series of atmospheric rivers in California, the floods in Italy and Brazil and last month in Hong Kong. 

Companies can get ahead by responding faster and more effectively. 

GC AdvantagePoint ® uses the latest climate science to help you manage catastrophe events as they happen.

  • Gulf Floods

    Dubai, UAE

    Starting April 14, 2024, severe weather hit the Arabian Gulf, mostly affecting Oman and the UAE. Extreme amounts of rain were brought by the storms. The scale of this event is exceptional, with the National Center of Meteorology announcing the UAE experienced the largest amount of rainfall since 1949, with more than 250 mm in a single day.
  • Hong Kong

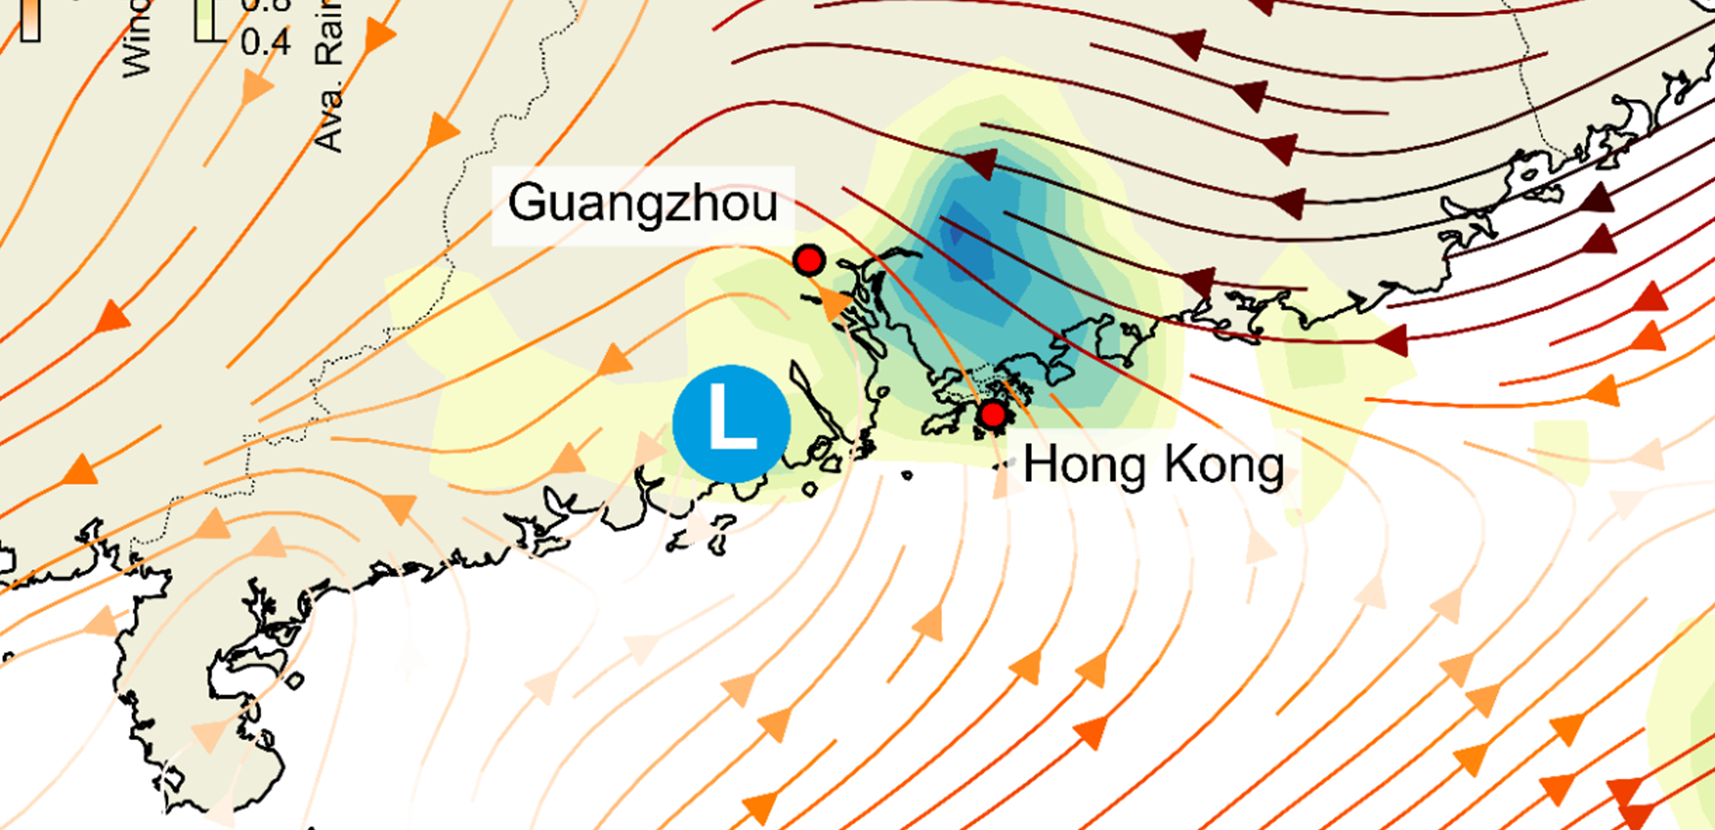
    The western North Pacific typhoon season was very active in late August 2023, with 4 tropical cyclone formations in a week. On August 28, a tropical low northwest of Guam was upgraded to tropical storm and named Haikui. The storm moved mostly westward and gradually intensified over the open Pacific.
  • California, US

    California was impacted by a series of atmospheric rivers between December 26, 2022 to January 17, 2023. The storm brought torrential rains, widespread flooding, and landslides to nearly the entire state. A Presidential Major Disaster Declaration was put into effect in 41 out of California’s 58 counties. Over 96,000 residents were evacuated, 500,000 homes and businesses were left without power, and 20 total fatalities were reported.
  • Sao Paulo, Brazil

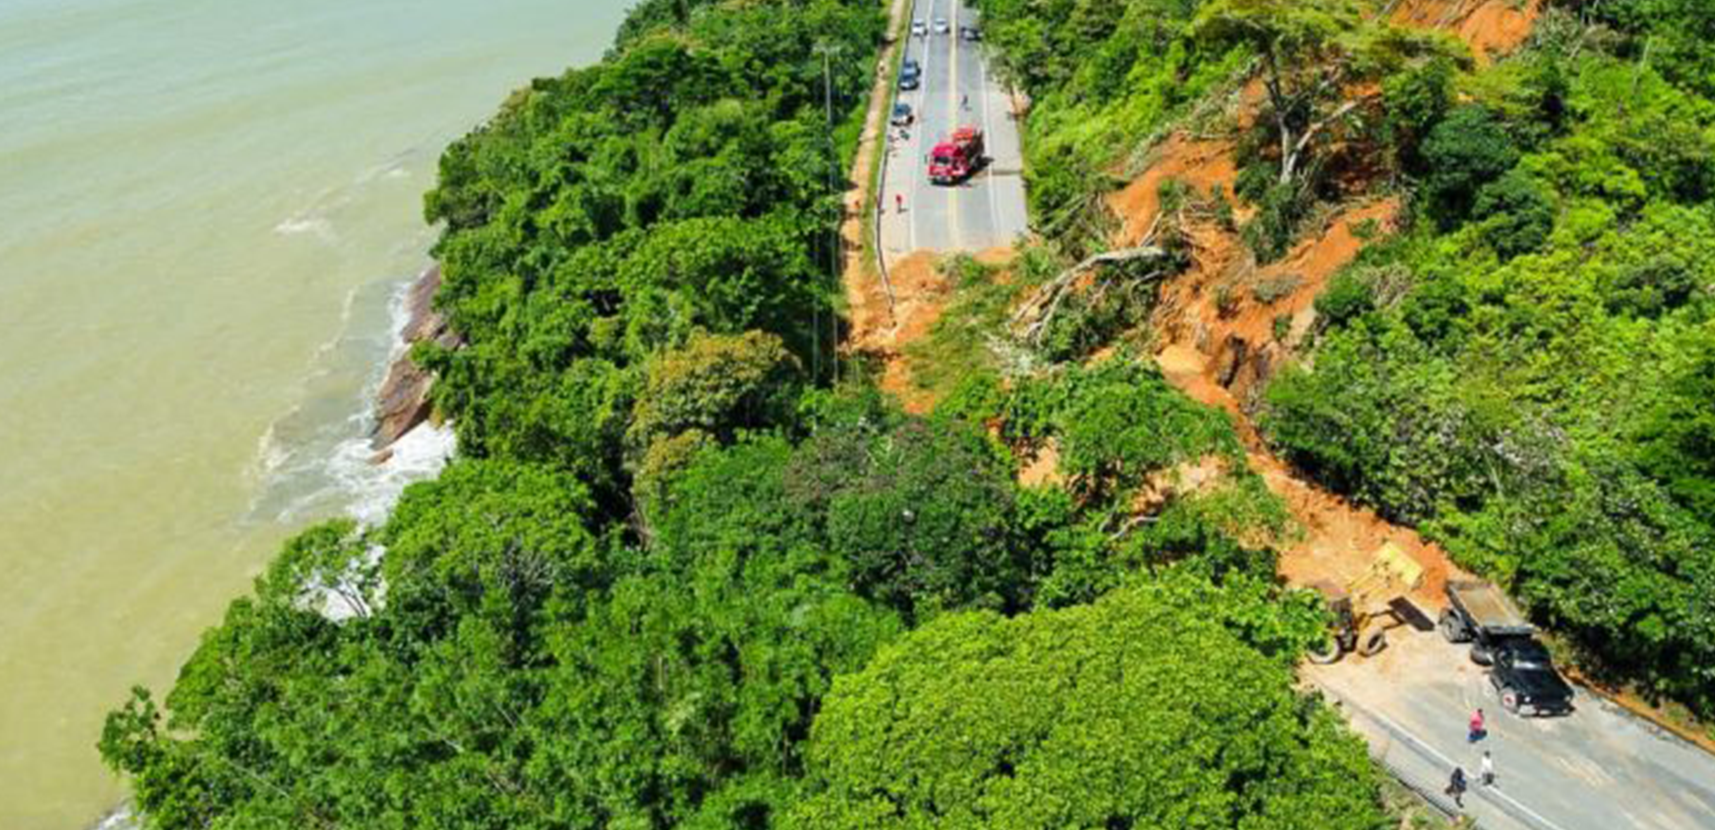
    At least 600 millimeters (24 inches) of rain fell in a single day in Brazil’s southeastern state of São Paulo on February 19. The record-breaking rainfall inundated the municipalities of Bertioga, Caraguatatuba, Guarujá, Ilhabela, São Sebastião and Ubatuba, making some of the worst flooding conditions the state has ever seen.
  • North Island, New Zealand

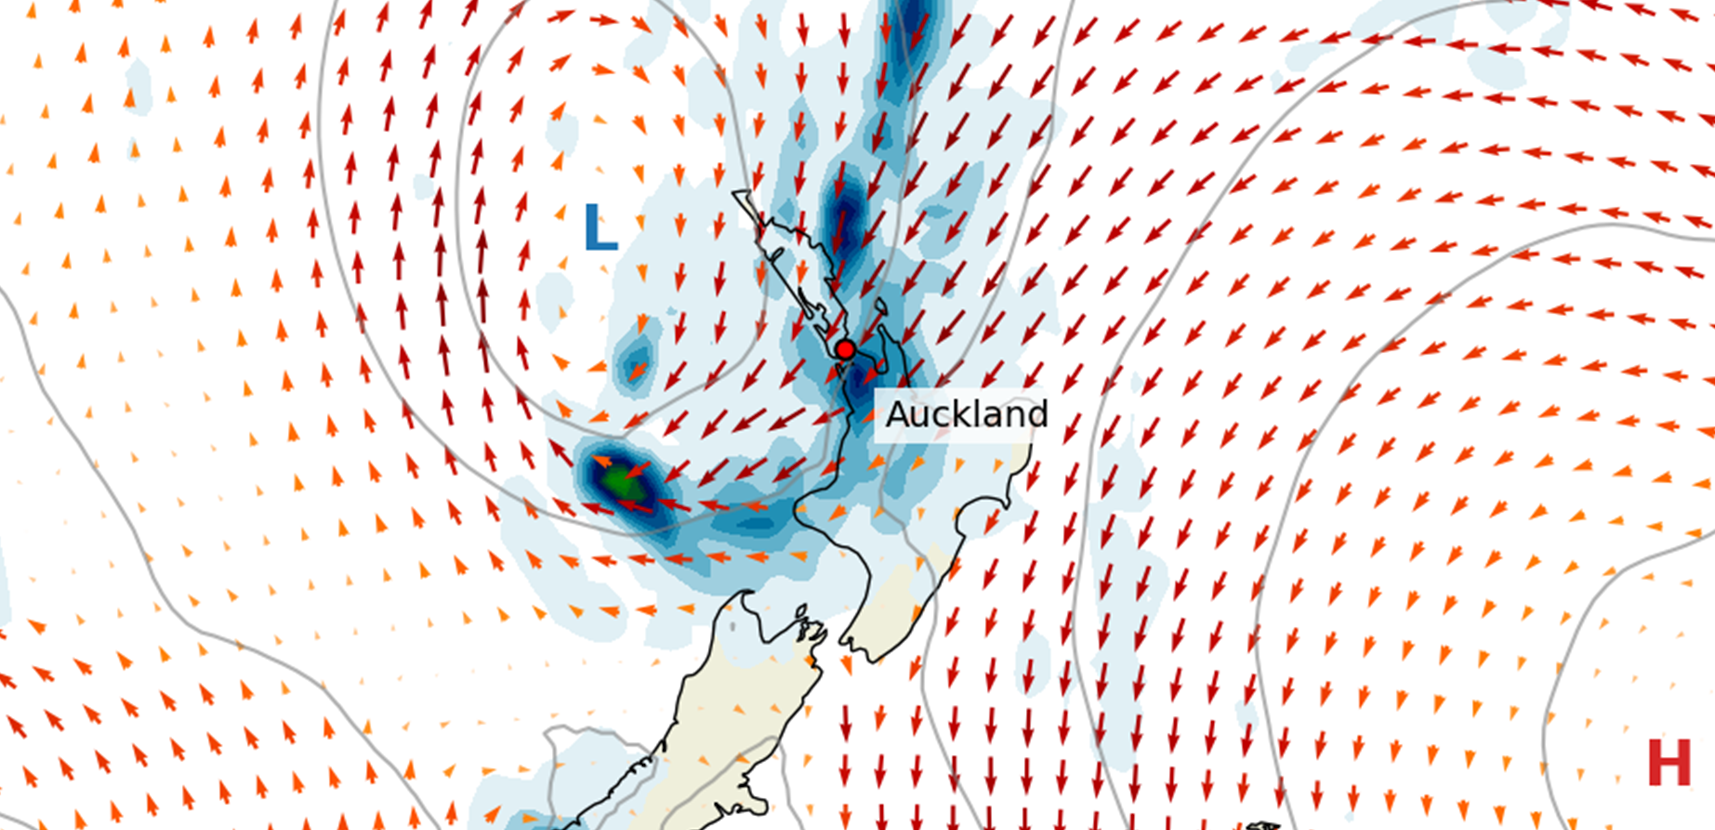
    On Friday, 27 January 2023, torrents of thunderstorms associated with a low-pressure system hit Auckland. According to New Zealand MetService, the rainstorm set a new daily rainfall record of 245 mm (83.2 mm greater than the prior record for Auckland Airport weather station), as well as a new monthly record of 419.6 mm (115 mm more than the previous monthly record, July 1998).
  • Emilia-Romagna, Italy

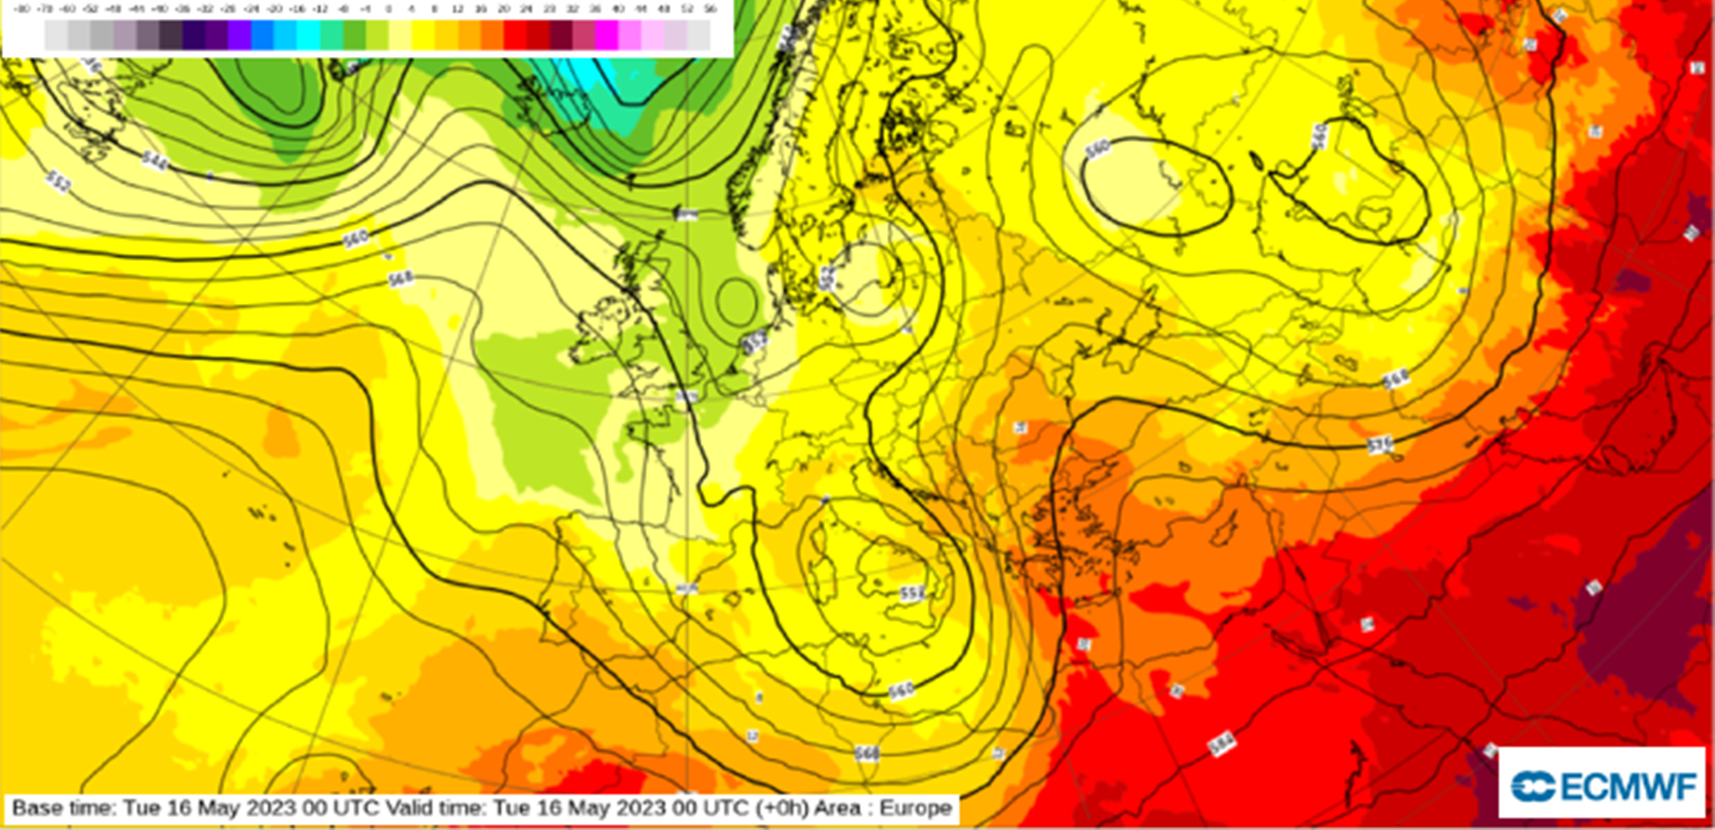
    In mid-May, extreme rainfall occurred in Emilia-Romagna, the same region that flooded earlier in the month. At one point during the period, the Civil Protection Department reported 36,000 residents relocated—among the largest numbers reported for flood events in the prior 20 years.

Read more about GC AdvantagePoint in our press release

CONTACT US

If you're interested in speaking with someone to learn more or to get a demo, please reach out.


  • Shannon Peterson

    Head of Global Analytics Product Management
    M +1 612 206 4675
    Shannon.R.Peterson@guycarp.com


  • Sherry Thomas

    Global Analytics Product & Platform Management Leader
    M +1 952-217-9159
    Sherry.L.Thomas@guycarp.com

Footer